


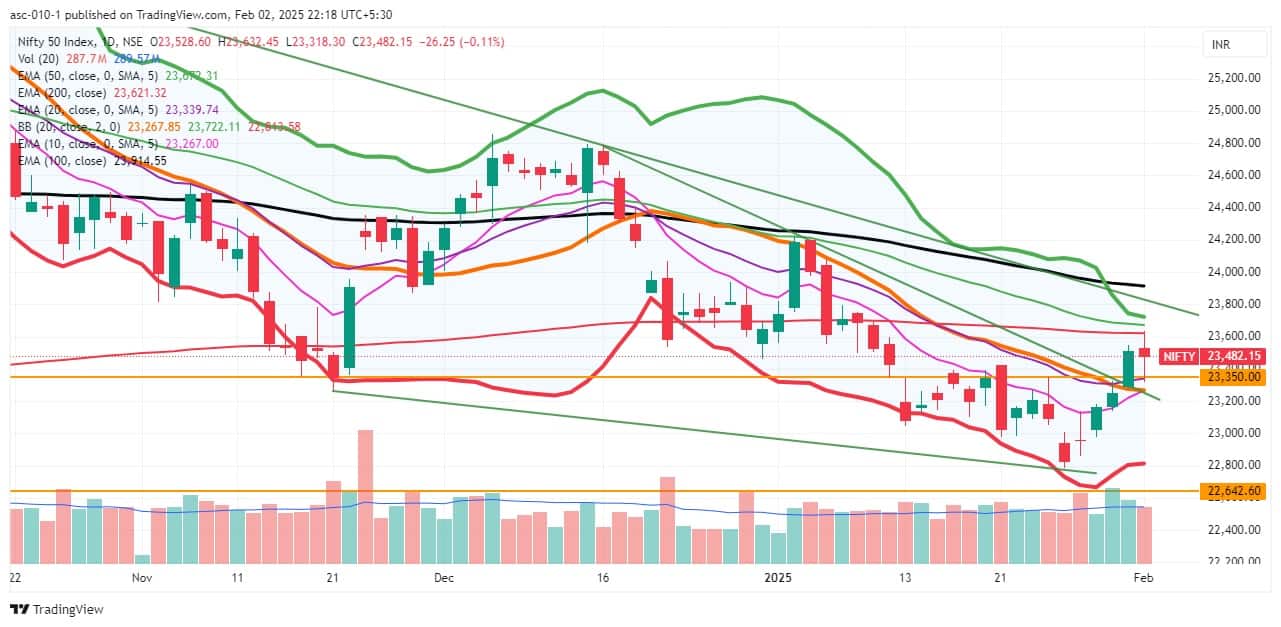
The Nifty 50 fell, though moderately, for the first time in the last five consecutive sessions, closing with a loss of just 26 points on February 1, the budget day. However, the index maintained a higher highs-higher lows formation for five consecutive days and negated the lower highs-lower tops formation, signaling a positive trend. The index firmly stayed above the upper range of the previous two weeks, i.e., above 23,400. Therefore, as long as the index stays above this level, a march towards 23,600 (200-day EMA) and 23,700 (near the 50-day EMA) remains possible in the upcoming sessions. However, in the case of profit booking, 23,300 may act as support, according to experts.
Here are 15 data points we have collated to help you spot profitable trades:
1) Key Levels For The Nifty 50 (23,482)
Resistance based on pivot points: 23,598, 23,672, and 23,792
Support based on pivot points: 23,358, 23,284, and 23,164
Special Formation: The Nifty 50 formed a small bearish candle with upper and lower shadows, resembling a high wave candlestick pattern on the daily charts, indicating volatility. The index sustained above the 10 and 20-day EMAs and stayed above the midline of the Bollinger Bands, which is a positive sign. The momentum indicator, RSI (Relative Strength Index, at 51.5), stayed in the upper band.
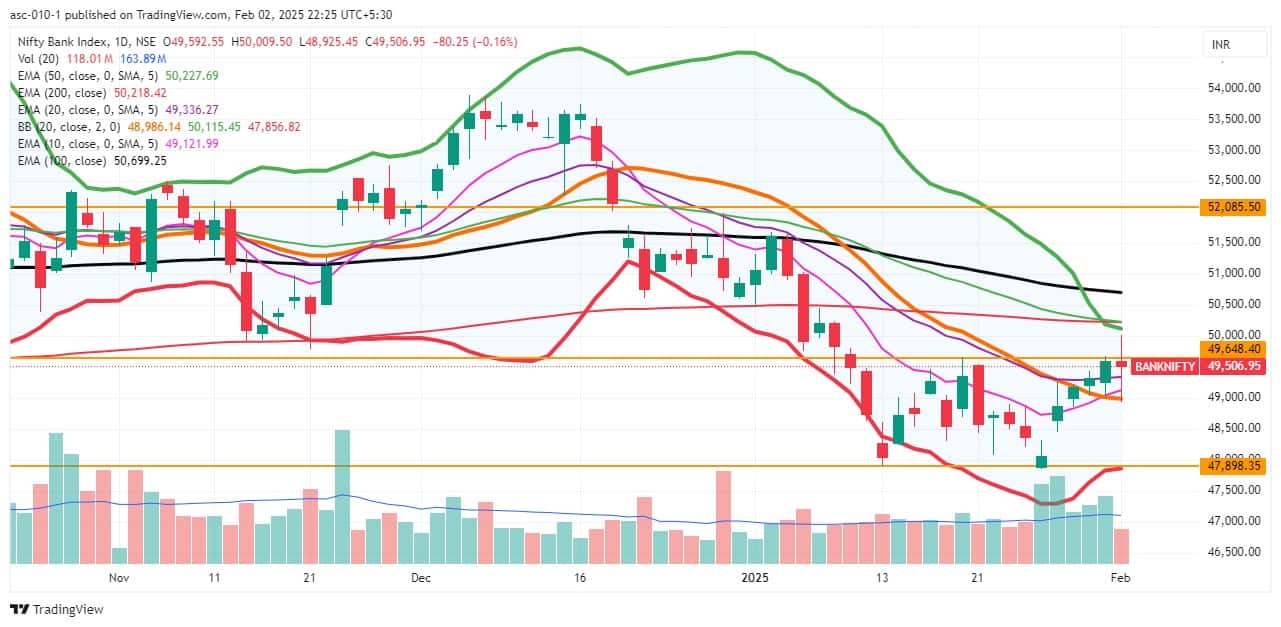
2) Key Levels For The Bank Nifty (49,507)
Resistance based on pivot points: 49,895, 50,151, and 50,565
Support based on pivot points: 49,066, 48,811, and 48,397
Resistance based on Fibonacci retracement: 50,391, 51,178
Support based on Fibonacci retracement: 47,875, 46,078
Special Formation: The Bank Nifty also formed a high wave-like candlestick pattern on the daily timeframe, indicating volatility. However, the near-term trend seems to have turned positive, considering the higher highs formation in the last few sessions and the index trading above short-term moving averages (10 and 20-day EMAs), as well as above the midline of the Bollinger Bands.
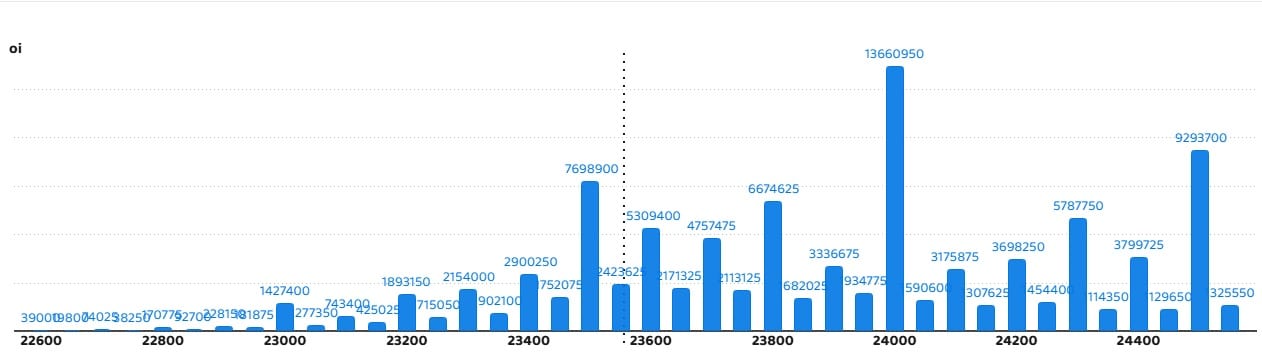
According to the weekly options data, the maximum Call open interest was seen at the 24,000 strike (with 1.36 crore contracts). This level can act as a key resistance for the Nifty in the short term. It was followed by the 24,500 strike (92.93 lakh contracts) and the 23,500 strike (76.98 lakh contracts).
Maximum Call writing was observed at the 24,000 strike, which saw an addition of 59.49 lakh contracts, followed by the 24,500 and 23,800 strikes, which added 50.53 lakh and 47.45 lakh contracts, respectively. The maximum Call unwinding was seen at the 23,200 strike which shed 3.9 lakh contracts, followed by the 23,300 and 23,000 strikes which shed 3.67 lakh and 2.11 lakh contracts, respectively.
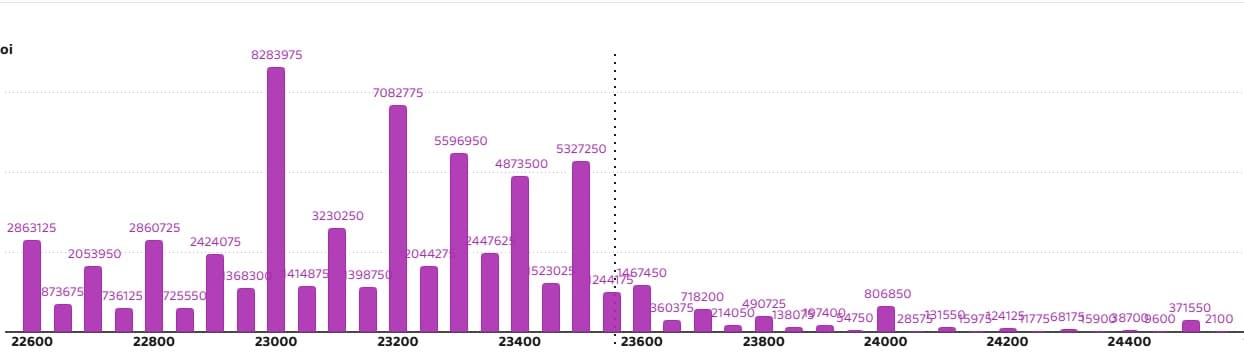
On the Put side, the 23,000 strike holds the maximum Put open interest (with 82.83 lakh contracts), which can act as a key support level for the Nifty. It was followed by the 23,200 strike (70.82 lakh contracts) and the 23,300 strike (55.96 lakh contracts).
The maximum Put writing was placed at the 23,200 strike, which saw an addition of 32.48 lakh contracts, followed by the 23,000 and 22,600 strikes, which added 26.3 lakh and 18.77 lakh contracts, respectively. The maximum Put unwinding was seen at the 22,700 strike, which shed 11.15 lakh contracts, followed by the 24,500 and 23,450 strikes, which shed 2.49 lakh and 1.58 lakh contracts, respectively.
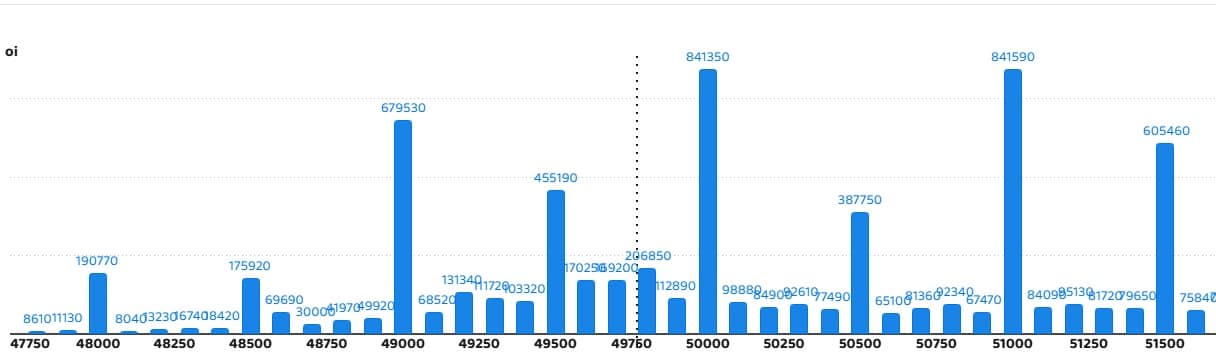
5) Bank Nifty Call Options Data
According to the monthly options data, the maximum Call open interest was seen at the 51,000 strike, with 8.41 lakh contracts. This can act as a key resistance level for the index in the short term. It was followed by the 50,000 strike (8.41 lakh contracts) and the 49,000 strike (6.79 lakh contracts).
Maximum Call writing was visible at the 51,500 strike (with the addition of 2.62 lakh contracts), followed by the 51,000 strike (1.4 lakh contracts) and the 50,000 strike (1.25 lakh contracts). The maximum Call unwinding was seen at the 48,000 strike, which shed 4,800 contracts, followed by the 49,100 and 48,700 strikes, which shed 2,310 and 540 contracts, respectively.
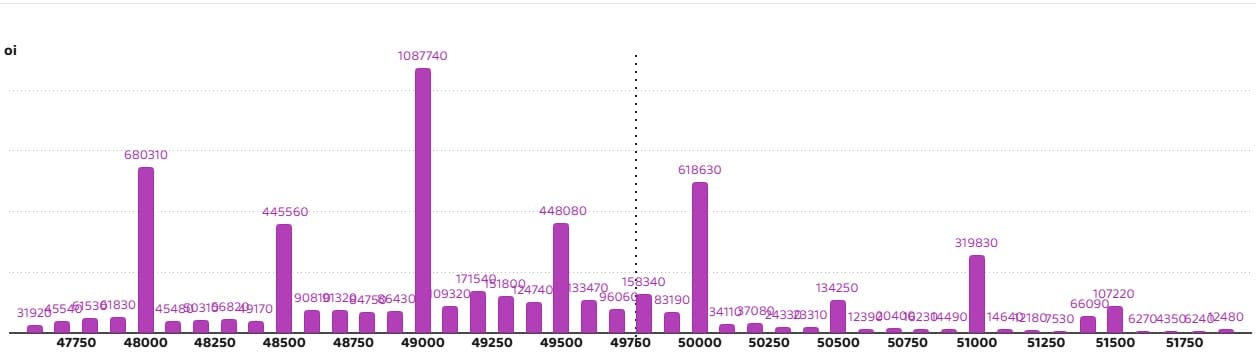
6) Bank Nifty Put Options Data
On the Put side, the 49,000 strike holds the maximum Put open interest (with 10.87 lakh contracts), which can act as a key support level for the index. This was followed by the 48,000 strike (6.8 lakh contracts) and the 50,000 strike (6.18 lakh contracts).
The maximum Put writing was observed at the 49,000 strike (which added 82,170 contracts), followed by the 50,000 strike (43,620 contracts) and the 49,500 strike (43,410 contracts). The maximum Put unwinding was seen at the 49,200 strike, which shed 23,010 contracts, followed by the 48,500 and 49,300 strikes which shed 19,260 and 7,890 contracts, respectively.
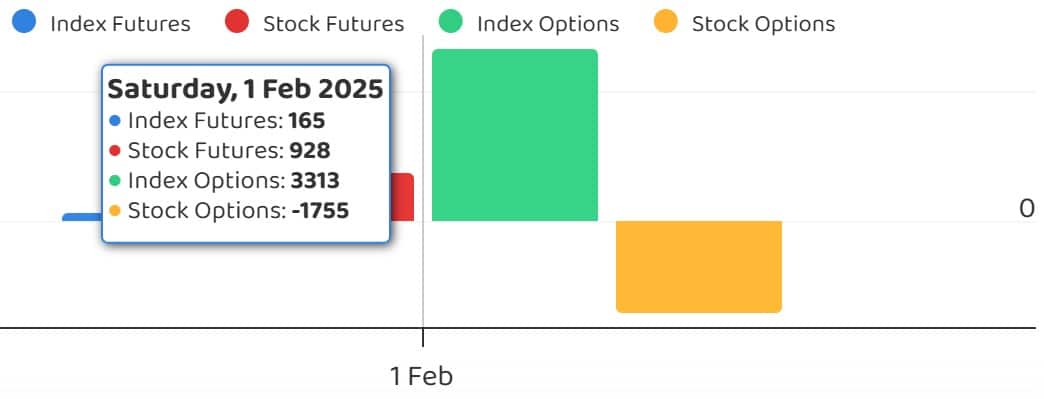
7) Funds Flow (Rs crore)
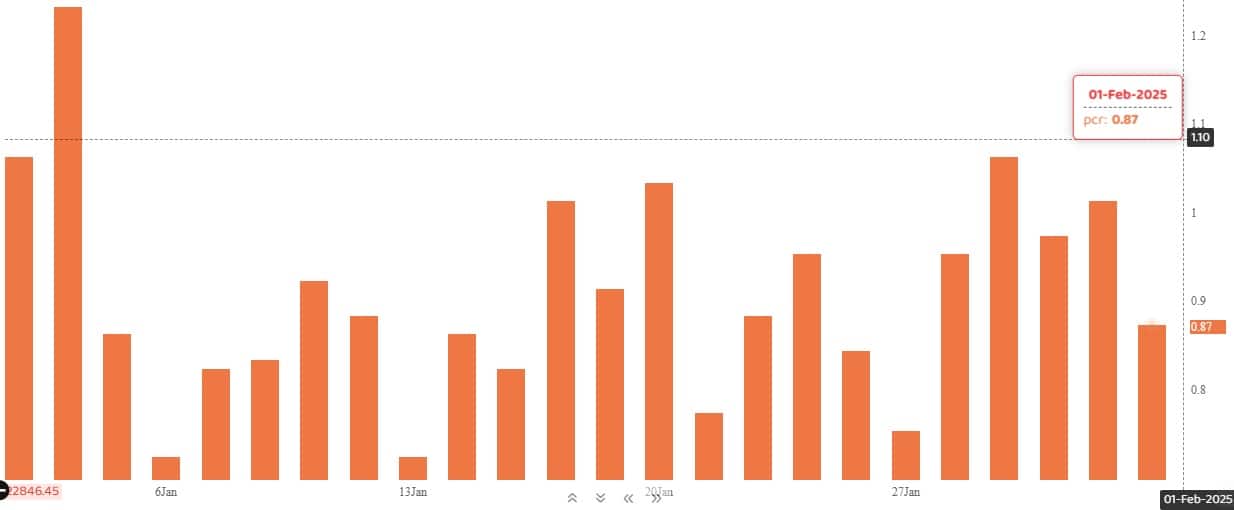
The Nifty Put-Call ratio (PCR), which indicates the mood of the market, dropped to 0.87 on February 1, from 1.01 level in the previous session.
The increasing PCR, or being higher than 0.7 or surpassing 1, means traders are selling more Put options than Call options, which generally indicates the firming up of a bullish sentiment in the market. If the ratio falls below 0.7 or moves towards 0.5, then it indicates selling in Calls is higher than selling in Puts, reflecting a bearish mood in the market.
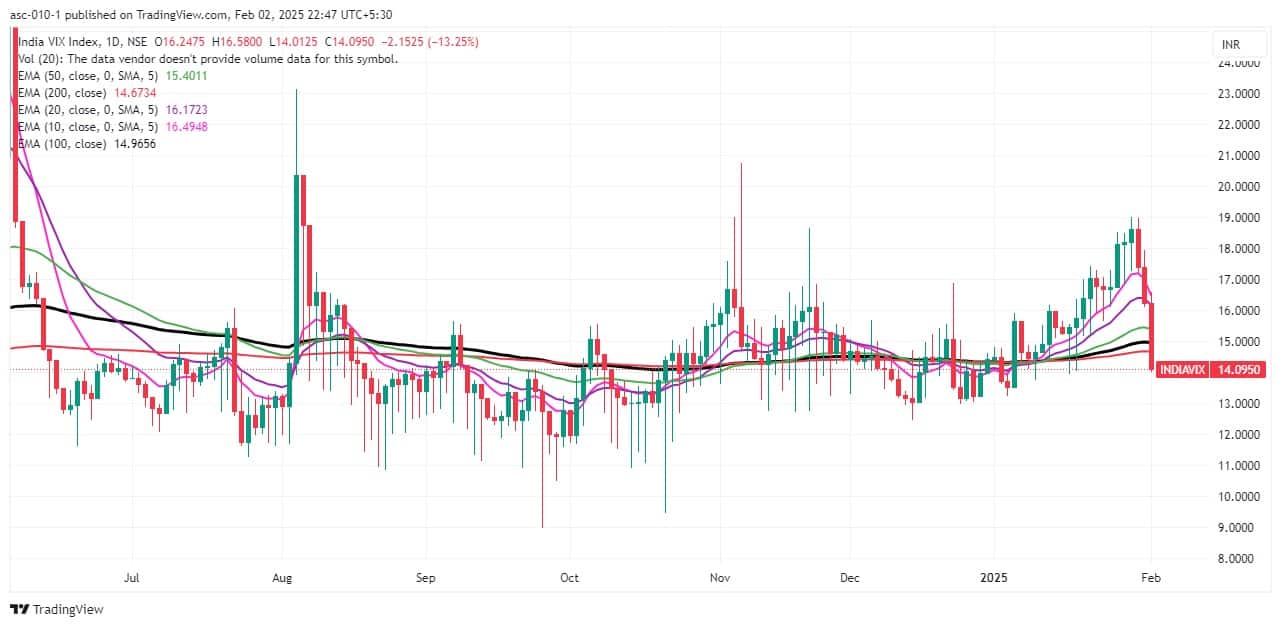
9) India VIX
The India VIX, the fear gauge that measures expected market volatility, declined sharply by 13.25 percent to 14.10, continuing its sharp downtrend for the third consecutive session, which is putting the bulls in a comfort zone.
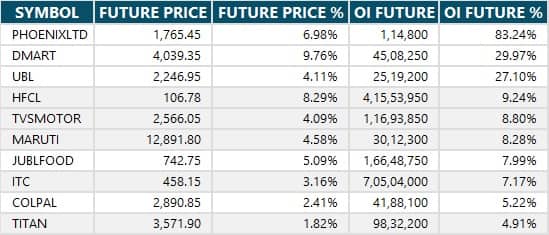
A long build-up was seen in 62 stocks. An increase in open interest (OI) and price indicates a build-up of long positions.
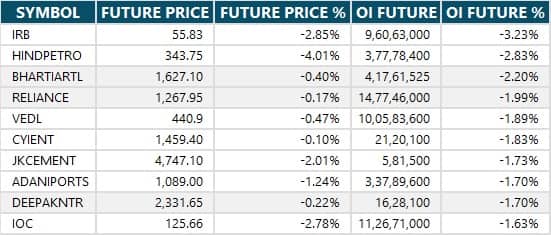
11) Long Unwinding (39 Stocks)
39 stocks saw a decline in open interest (OI) along with a fall in price, indicating long unwinding.
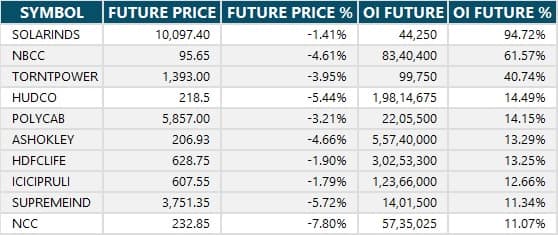
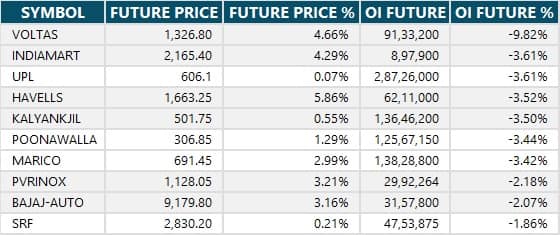
12) Short Build-up (105 Stocks)
105 stocks saw an increase in OI along with a fall in price, indicating a build-up of short positions.
13) Short-Covering (26 Stocks)
26 stocks saw short-covering, meaning a decrease in OI, along with a price increase.
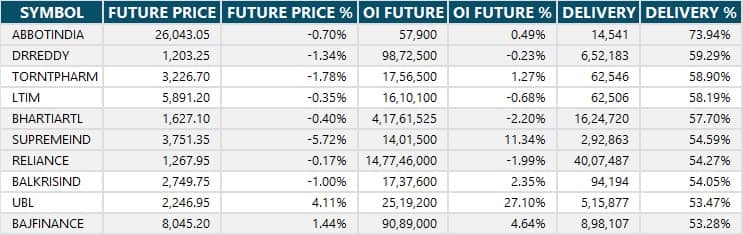
Here are the stocks that saw a high share of delivery trades. A high share of delivery reflects investing (as opposed to trading) interest in a stock.
Securities banned under the F&O segment include companies where derivative contracts cross 95 percent of the market-wide position limit.
Stocks added to F&O ban: Nil
Stocks retained in F&O ban: Nil
Stocks removed from F&O ban: Nil
Disclaimer: The views and investment tips expressed by experts on Moneycontrol are their own and not those of the website or its management. Moneycontrol advises users to check with certified experts before taking any investment decisions.Disclosure: Moneycontrol is a part of the Network18 group. Network18 is controlled by Independent Media Trust, of which Reliance Industries is the sole beneficiary.Discover the latest Business News, Sensex, and Nifty updates. Obtain Personal Finance insights, tax queries, and expert opinions on Moneycontrol or download the Moneycontrol App to stay updated!
Find the best of Al News in one place, specially curated for you every weekend.
Stay on top of the latest tech trends and biggest startup news.


