


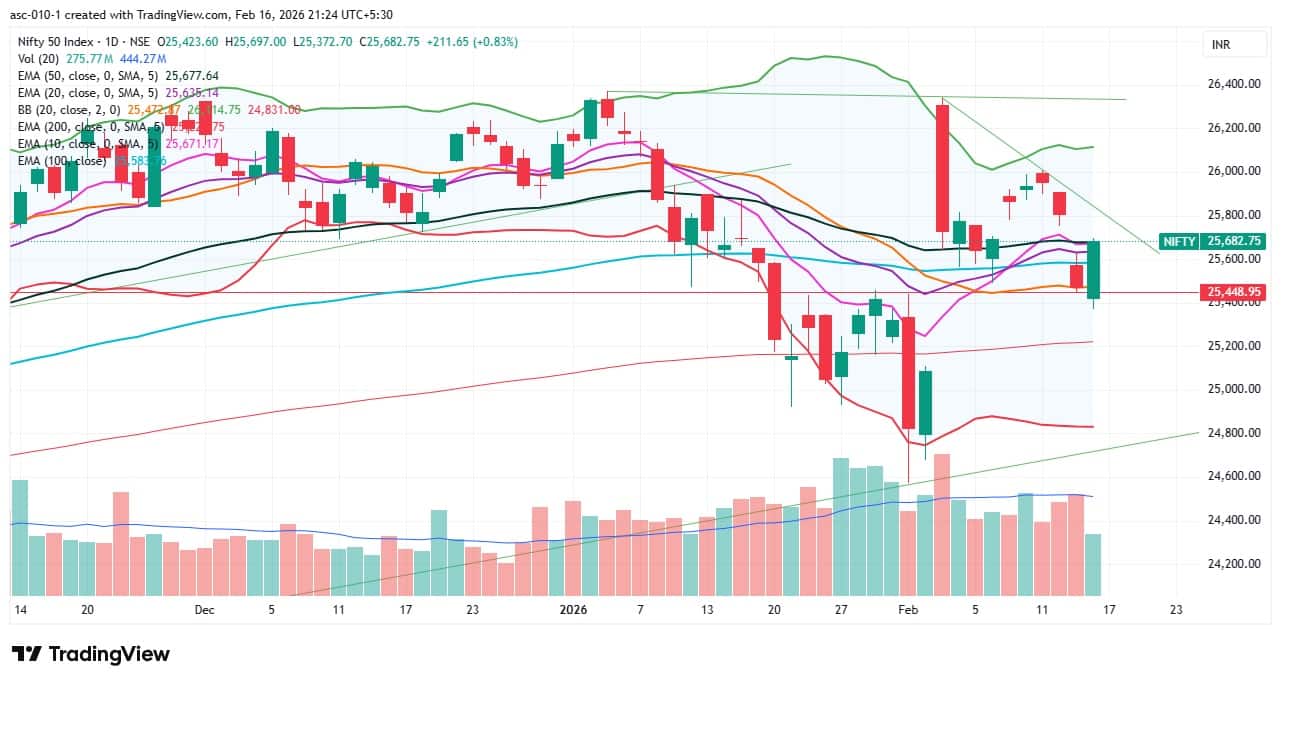
The Nifty 50 rebounded sharply after a day of steep decline, rising 0.83 percent and marking a healthy start to the week on February 16. The benchmark index also formed a bullish reversal pattern and climbed back above key moving averages, with a positive crossover in the RSI. However, the India VIX continues to signal caution for bulls. The index needs to fill the bearish gap of February 13 by decisively surpassing and sustaining above 25,750 for a move towards 26,000. Until then, consolidation with range-bound trading may continue, with crucial support placed at 25,500–25,470, according to experts.
Here are 15 data points we have collated to help you spot profitable trades:
1) Key Levels For The Nifty 50 (25,683)
Resistance based on pivot points: 25,708, 25,785, and 25,908
Support based on pivot points: 25,460, 25,384, and 25,260
Special Formation: The Nifty 50 formed a long bullish engulfing candlestick pattern on the daily charts — a bullish reversal formation that appeared after a downtrend, signalling a potential trend reversal. The index climbed above all key moving averages (20-, 50-, and 100-day EMAs) as well as the midline of the Bollinger Bands in a single session, though it still remains within the bearish gap of February 13. The RSI moved above the reference line to 50.87, but the Stochastic RSI maintained a bearish crossover. The MACD sustained its positive crossover; however, the histogram indicated fading momentum. All this indicates improving sentiment, though confirmation through follow-up buying is required.
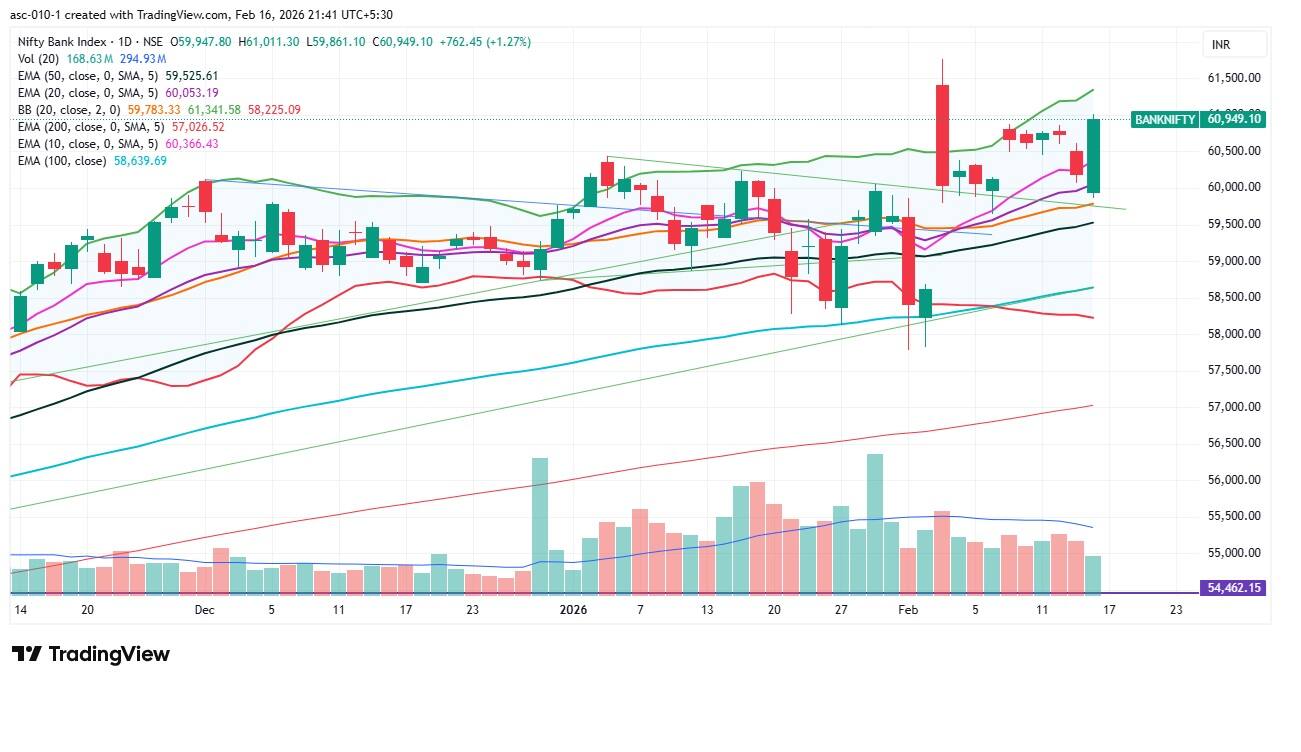
2) Key Levels For The Bank Nifty (60,949)
Resistance based on pivot points: 61,047, 61,318, and 61,757
Support based on pivot points: 60,168, 59,896, and 59,457
Resistance based on Fibonacci retracement: 61,160, 62,075
Support based on Fibonacci retracement: 60,000, 59,452
Special Formation: The Bank Nifty formed a similar pattern to the Nifty 50 and closed well above all key moving averages, rising 1.27 percent and signalling a healthy bullish move after recent consolidation. The index also closed above 60,900 — the upper end of its consolidation range — and sustained above the falling support trendline. The RSI rose to 60.4, while the MACD maintained its uptrend, with a healthy signal from the histogram. All this indicates strengthening momentum and room for further upside, provided broader market conditions remain supportive.
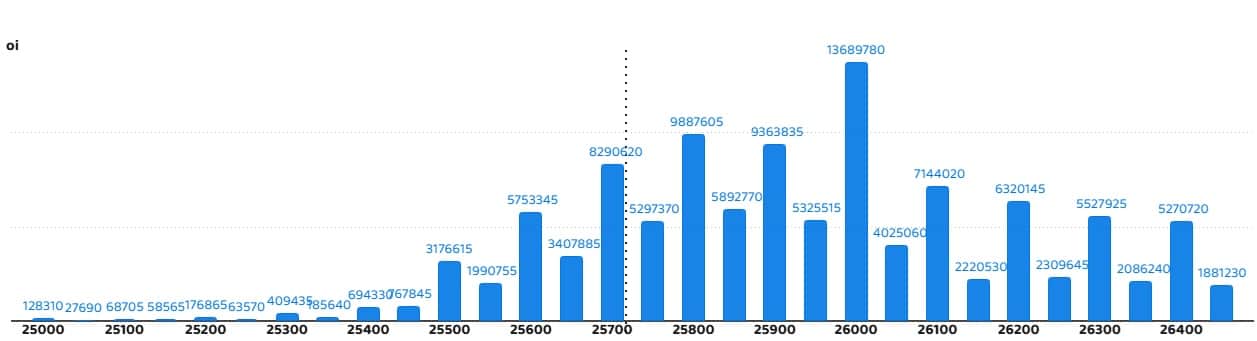
According to the weekly options data, the maximum Call open interest was seen at the 26,000 strike (with 1.36 crore contracts). This level can act as a key resistance level for the Nifty in the short term. It was followed by the 25,800 strike (98.87 lakh contracts) and 25,900 strike (93.63 lakh contracts).
Maximum Call writing was observed at the 25,750 strike, which saw an addition of 8.5 lakh contracts, followed by the 25,150 strike, which added 3,835 contracts. The maximum Call unwinding was seen at the 25,600 strike which shed 70.71 lakh contracts, followed by the 25,500 and 25,550 strikes, which shed 61.19 lakh and 34.69 lakh contracts, respectively.
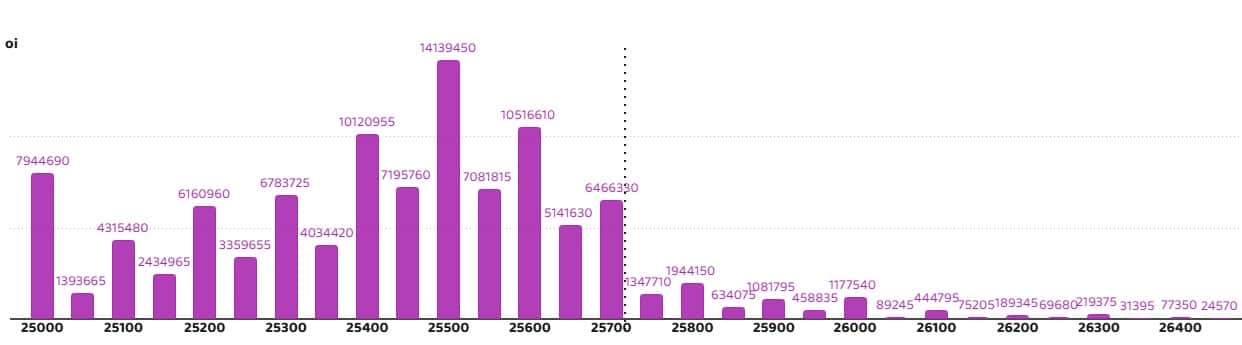
On the Put side, the 25,500 strike holds the maximum Put open interest (with 1.41 crore contracts), which can act as a key support level for the Nifty in the short term. It was followed by the 25,600 strike (1.05 crore contracts) and the 25,400 strike (1.01 crore contracts).
The maximum Put writing was placed at the 25,500 strike, which saw an addition of 75.71 lakh contracts, followed by the 25,600 and 25,400 strikes, which added 65.50 lakh and 56.36 lakh contracts, respectively. The maximum Put unwinding was seen at the 25,900 strike, which shed 7.19 lakh contracts, followed by the 25,000 and 26,000 strikes, which shed 3.48 lakh and 3.22 lakh contracts, respectively.
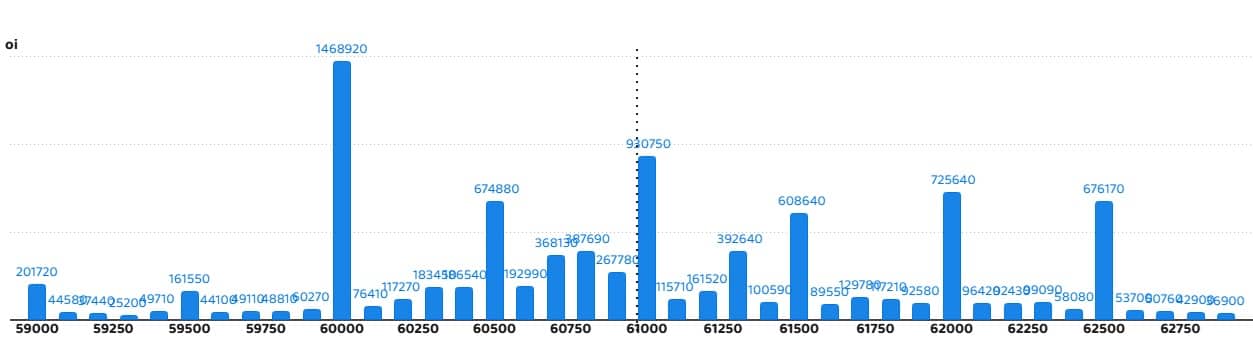
5) Bank Nifty Call Options Data
According to the monthly options data, the maximum Call open interest was seen at the 60,000 strike, with 14.68 lakh contracts. This can act as a key level for the index in the short term. It was followed by the 61,000 strike (9.3 lakh contracts) and the 62,000 strike (7.25 lakh contracts).
Maximum Call writing was observed at the 61,500 strike (with the addition of 1.13 lakh contracts), followed by the 61,000 strike (51,840 contracts) and 60,900 strike (27,960 contracts). The maximum Call unwinding was seen at the 60,500 strike, which shed 2.92 lakh contracts, followed by the 62,500 and 60,700 strikes which shed 1.78 lakh and 1.58 lakh contracts, respectively.
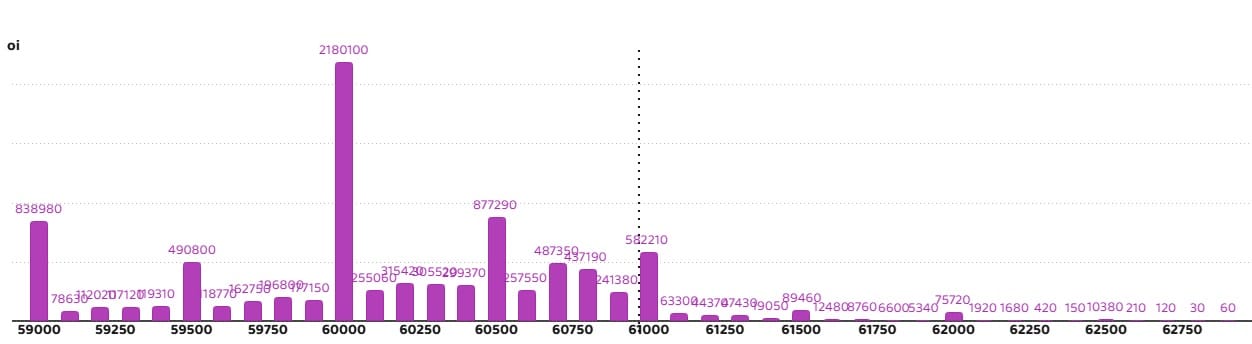
6) Bank Nifty Put Options Data
On the Put side, the 60,000 strike holds the maximum Put open interest (with 21.8 lakh contracts), which can act as a key support level for the index. This was followed by the 60,500 strike (8.77 lakh contracts) and the 59,000 strike (8.38 lakh contracts).
The maximum Put writing was placed at the 61,000 strike (which added 3.18 lakh contracts), followed by the 60,500 strike (2.84 lakh contracts) and the 60,800 strike (2.12 lakh contracts). There was hardly any Put unwinding seen in the 59,000-62,800 strike band.
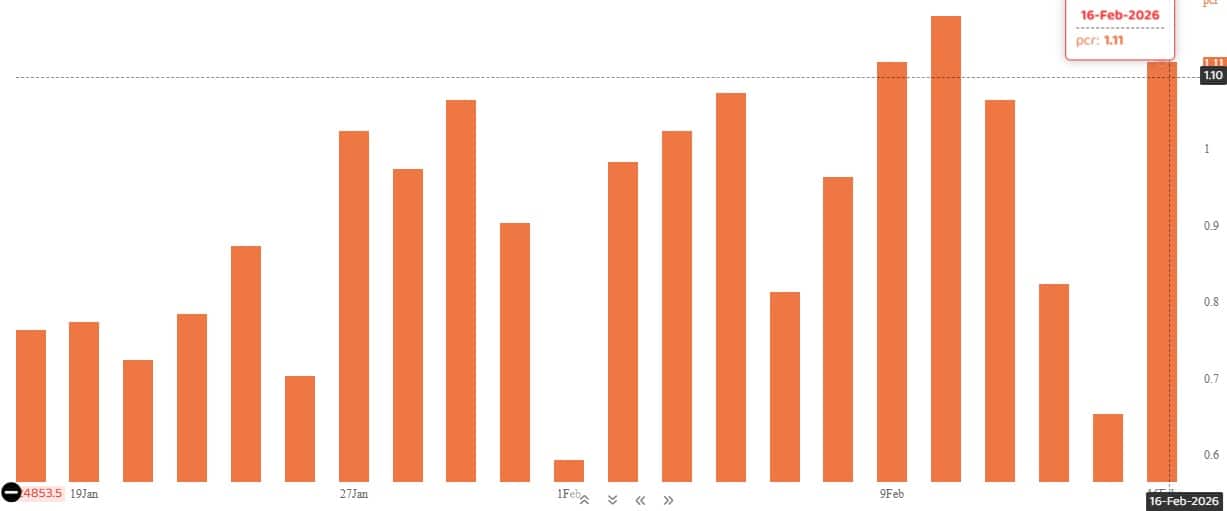
The Nifty Put-Call ratio (PCR), which indicates the mood of the market, jumped to 1.11 on February 16, compared to 0.65 in the previous session.
The increasing PCR, or being higher than 0.7 or surpassing 1, means traders are selling more Put options than Call options, which generally indicates the firming up of a bullish sentiment in the market. If the ratio falls below 0.7 or moves towards 0.5, then it indicates selling in Calls is higher than selling in Puts, reflecting a bearish mood in the market.
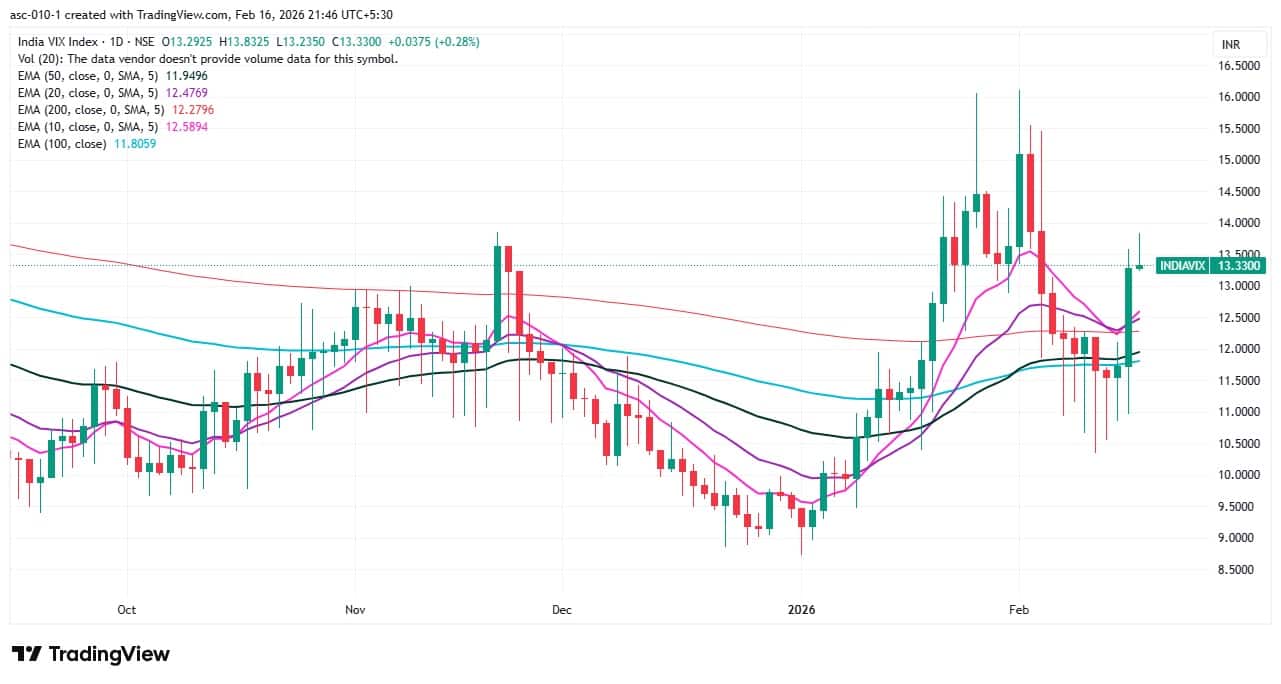
9) India VIX
The India VIX, which measures expected market volatility, remained at elevated levels and sustained well above all key moving averages, signalling caution for bulls. It rose 0.28 percent to 13.33. Bulls will remain at risk as long as the VIX stays above the 12 zone, experts said.
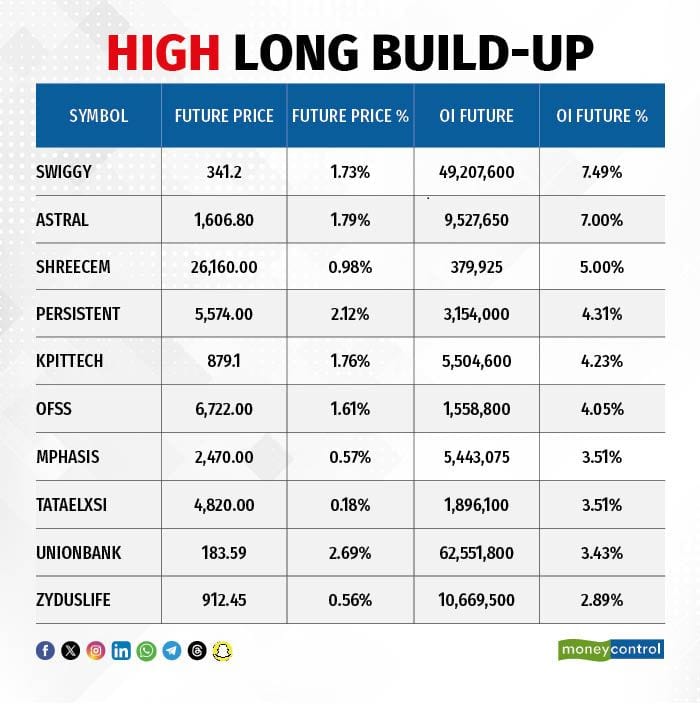
A long build-up was seen in 73 stocks. An increase in open interest (OI) and price indicates a build-up of long positions.
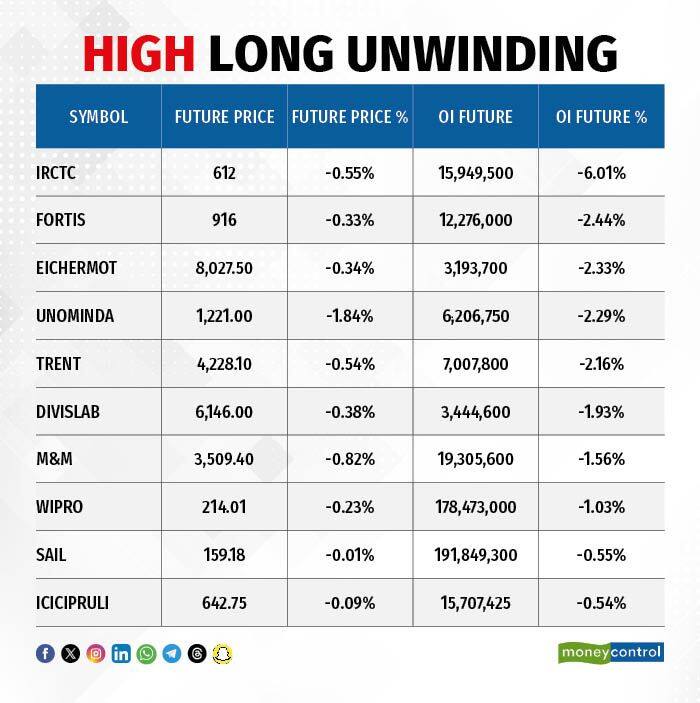
11) Long Unwinding (11 Stocks)
11 stocks saw a decline in open interest (OI) along with a fall in price, indicating long unwinding.
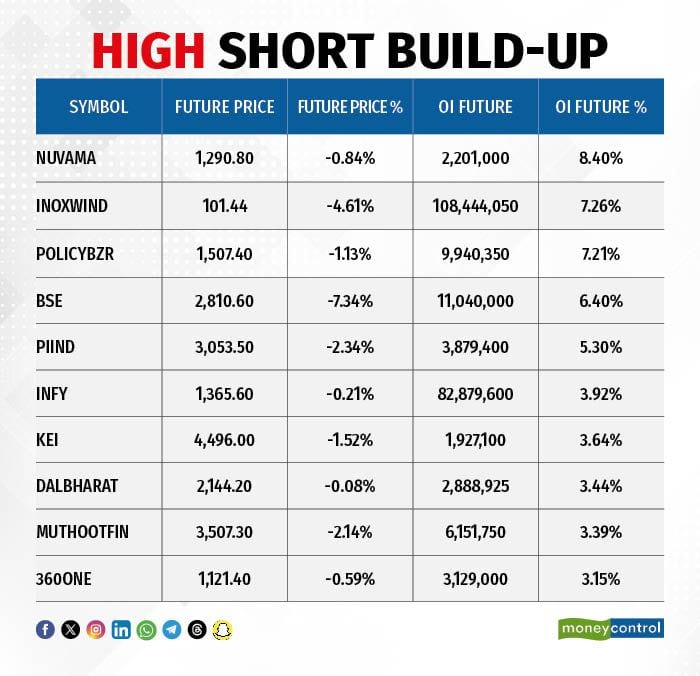
12) Short Build-up (33 Stocks)
33 stocks saw an increase in OI along with a fall in price, indicating a build-up of short positions.
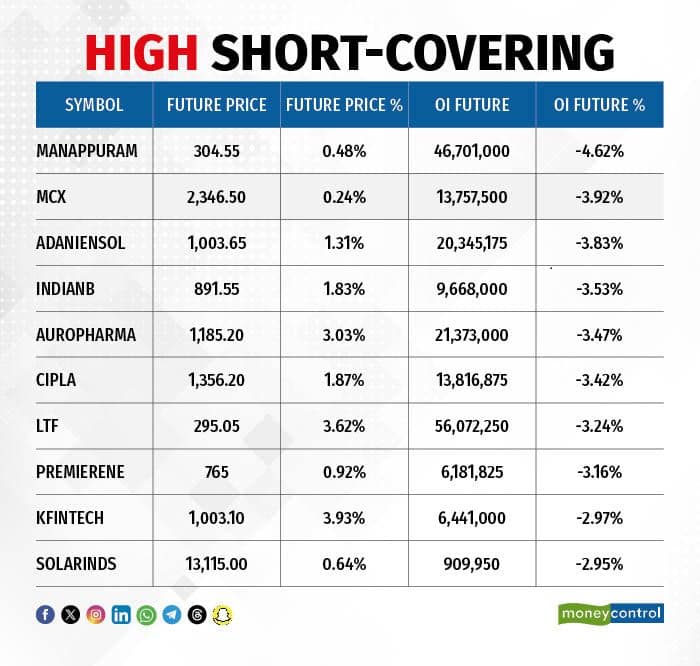
13) Short-Covering (94 Stocks)
94 stocks saw short-covering, meaning a decrease in OI, along with a price increase.
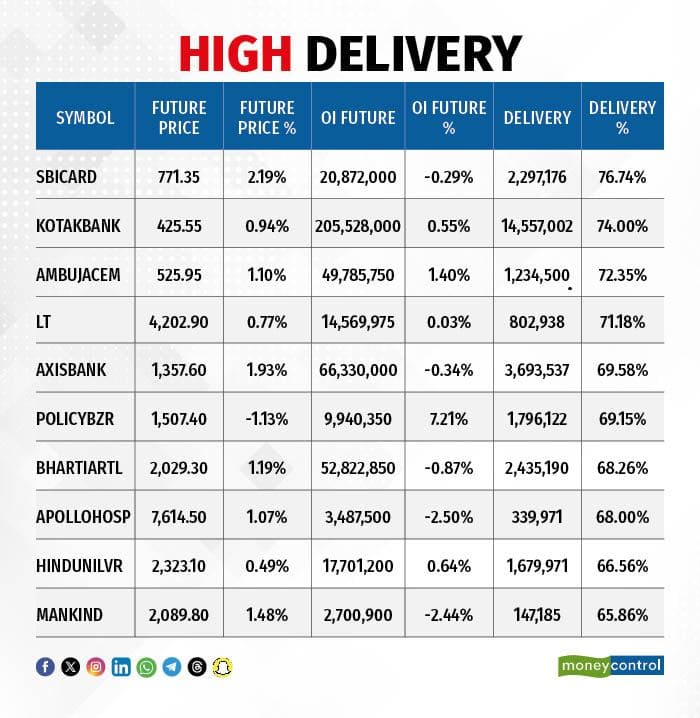
Here are the stocks that saw a high share of delivery trades. A high share of delivery reflects investing (as opposed to trading) interest in a stock.
Securities banned under the F&O segment include companies where derivative contracts cross 95 percent of the market-wide position limit.
Stocks added to F&O ban: Nil
Stocks retained in F&O ban: SAIL, Sammaan Capital
Stocks removed from F&O ban: Nil
Disclaimer: The views and investment tips expressed by experts on Moneycontrol are their own and not those of the website or its management. Moneycontrol advises users to check with certified experts before taking any investment decisions.Disclaimer: Moneycontrol is a part of the Network18 group. Network18 is controlled by Independent Media Trust, of which Reliance Industries is the sole beneficiary.Discover the latest Business News, Sensex, and Nifty updates. Obtain Personal Finance insights, tax queries, and expert opinions on Moneycontrol or download the Moneycontrol App to stay updated!
Find the best of Al News in one place, specially curated for you every weekend.
Stay on top of the latest tech trends and biggest startup news.


