


The benchmark Nifty 50 fell below the 10-day EMA and lost nearly 0.6 percent, continuing its downtrend for three days on the trot on December 2. Momentum indicators also indicated some more consolidation, though the higher high–higher low structure on the larger timeframes is still intact. As long as the index trades below 26,300, the key resistance zone for a sharp upmove, consolidation and rangebound trading may continue, with key support at the 25,900–25,850 zone, below which the selling pressure may widen, according to experts.

Here are 15 data points we have collated to help you spot profitable trades:
1) Key Levels For The Nifty 50 (26,032)
Resistance based on pivot points: 26,121, 26,158, and 26,218
Support based on pivot points: 26,002, 25,965, and 25,905
Special Formation: The Nifty 50 formed a bearish candle with both upper and lower shadows on the daily chart, indicating some weakness amid ongoing volatility. The index closed below the 10-day EMA but remained above all other key moving averages as well as the midline of the Bollinger Bands. The RSI dropped to 55.43 with a negative crossover, and the MACD also registered a bearish crossover, with the histogram slipping below the zero line. All this indicates emerging short-term weakness and the possibility of continued consolidation or a mild corrective phase.
2) Key Levels For The Bank Nifty (59,274)
Resistance based on pivot points: 59,549, 59,644, and 59,799
Support based on pivot points: 59,239, 59,144, and 58,989
Resistance based on Fibonacci retracement: 59,442, 60,847
Support based on Fibonacci retracement: 59,000, 58,650
Special Formation: The Bank Nifty also faced selling pressure, extending its downtrend for another session and declining nearly 0.7 percent on above-average volumes. The index formed a small bearish candle with a long upper shadow on the daily timeframe, signalling continued weakness and pressure at higher levels. The RSI dipped to 61.7 with a bearish crossover, while the MACD also turned bearish with the histogram falling below the zero line. All this indicates that the index may remain under pressure in the near term, with a higher probability of further pullbacks unless strong buying emerges at lower levels.

According to the weekly options data, the maximum Call open interest was seen at the 27,000 strike (with 66.36 lakh contracts). This level can act as a key resistance level for the Nifty in the short term. It was followed by the 26,200 strike (64.9 lakh contracts) and 26,300 strike (58.27 lakh contracts).
Maximum Call writing was observed at the 26,100 strike, which saw an addition of 37.82 lakh contracts, followed by the 26,200 and 26,000 strikes, which added 35.59 lakh and 31.17 lakh contracts, respectively. There was hardly any Call unwinding seen in the 25,500-27,000 strike band.

On the Put side, the 25,500 strike holds the maximum Put open interest (with 63.72 lakh contracts), which can act as a key support level for the Nifty in the short term. It was followed by the 26,000 strike (54.72 lakh contracts) and the 25,800 strike (45 lakh contracts).
The maximum Put writing was placed at the 26,000 strike, which saw an addition of 28.3 lakh contracts, followed by the 25,600 and 25,500 strikes, which added 20.02 lakh and 17.99 lakh contracts, respectively. The maximum Put unwinding was seen at the 26,300 strike, which shed 6.86 lakh contracts, followed by the 26,600 and 26,500 strikes, which shed 66,075 and 64,125 contracts, respectively.

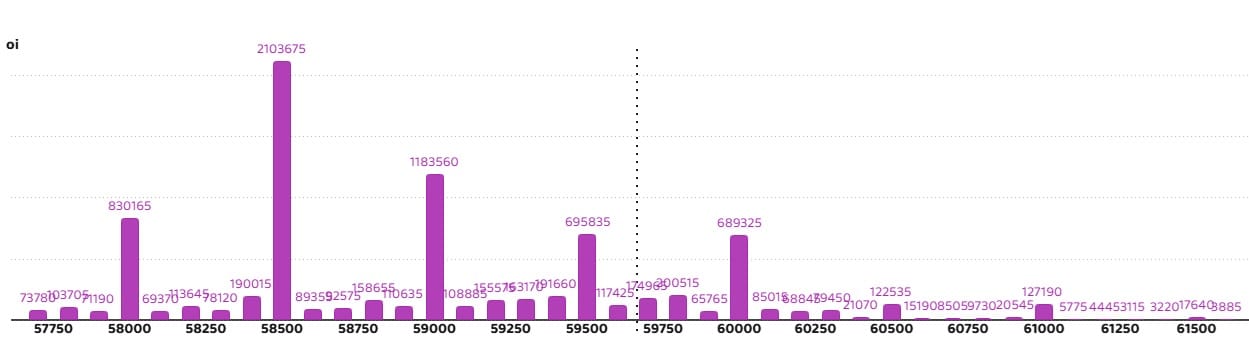
5) Bank Nifty Call Options Data
According to the monthly options data, the 60,000 strike holds the maximum Call open interest, with 13.48 lakh contracts. This can act as a key resistance level for the index in the short term. It was followed by the 58,500 strike (12.9 lakh contracts) and the 61,000 strike (7.15 lakh contracts).
Maximum Call writing was observed at the 59,500 strike (with the addition of 1.31 lakh contracts), followed by the 59,800 strike (1.09 lakh contracts) and 60,000 strike (87,185 contracts). The maximum Call unwinding was seen at the 58,000 strike, which shed 13,440 contracts, followed by the 60,300 and 58,900 strikes, which shed 3,920 and 3,535 contracts, respectively.

6) Bank Nifty Put Options Data
On the Put side, the maximum Put open interest was seen at the 58,500 strike (with 21.03 lakh contracts), which can act as a key support level for the index. This was followed by the 59,000 strike (11.83 lakh contracts) and the 58,000 strike (8.3 lakh contracts).
The maximum Put writing was placed at the 59,400 strike (which added 25,340 contracts), followed by the 58,100 strike (14,175 contracts) and the 59,800 strike (13,580 contracts). The maximum Put unwinding was seen at the 60,000 strike, which shed 1.13 lakh contracts, followed by the 59,500 and 59,000 strikes, which shed 59,990 and 49,070 contracts, respectively.

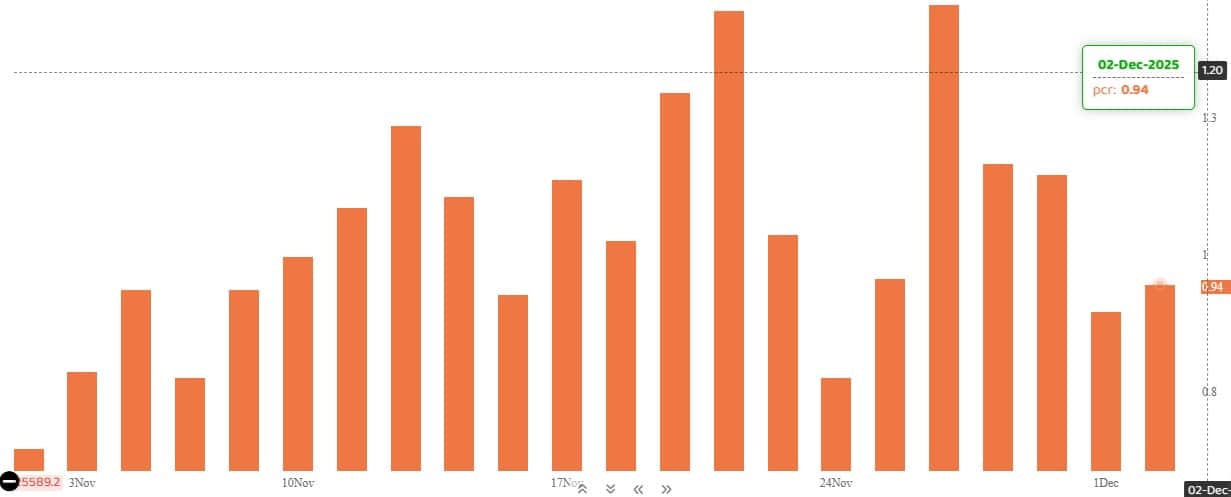
The Nifty Put-Call ratio (PCR), which indicates the mood of the market, climbed to 0.94 on December 2, compared to 0.89 in the previous session.
The increasing PCR, or being higher than 0.7 or surpassing 1, means traders are selling more Put options than Call options, which generally indicates the firming up of a bullish sentiment in the market. If the ratio falls below 0.7 or moves towards 0.5, then it indicates selling in Calls is higher than selling in Puts, reflecting a bearish mood in the market.
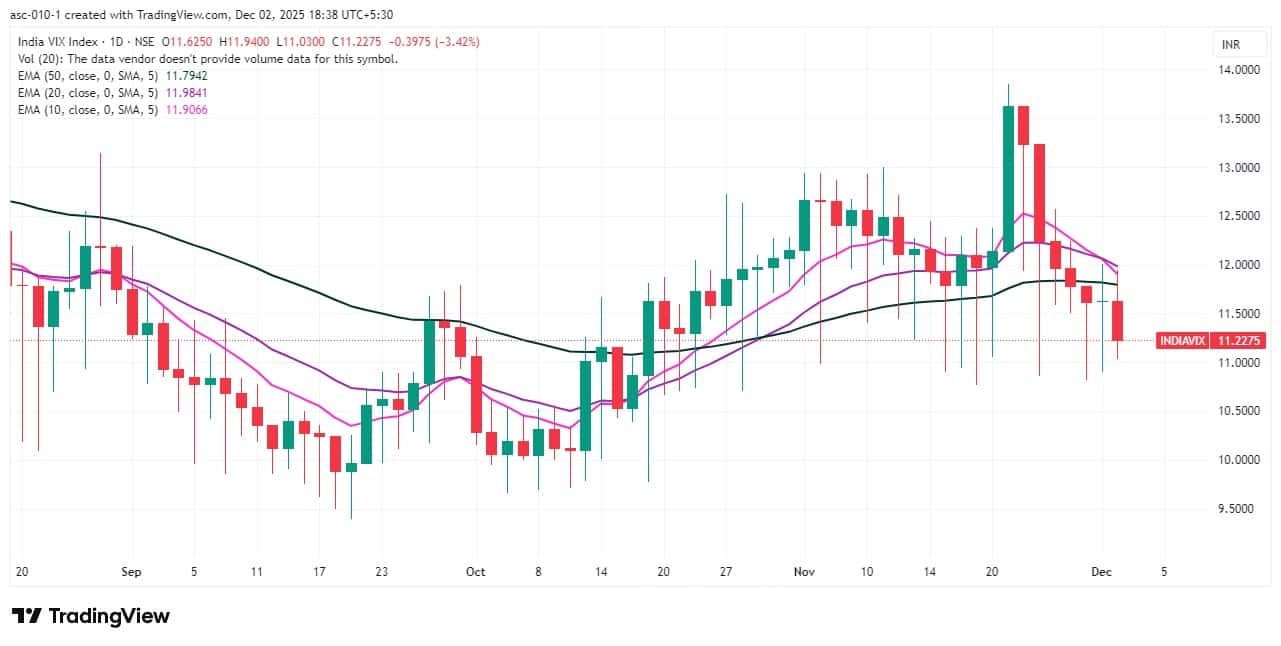
9) India VIX
The India VIX, which is also known as the fear gauge, declined 3.42 percent to 11.23 and sustained below all key moving averages, signalling continuation of comfort for bulls.
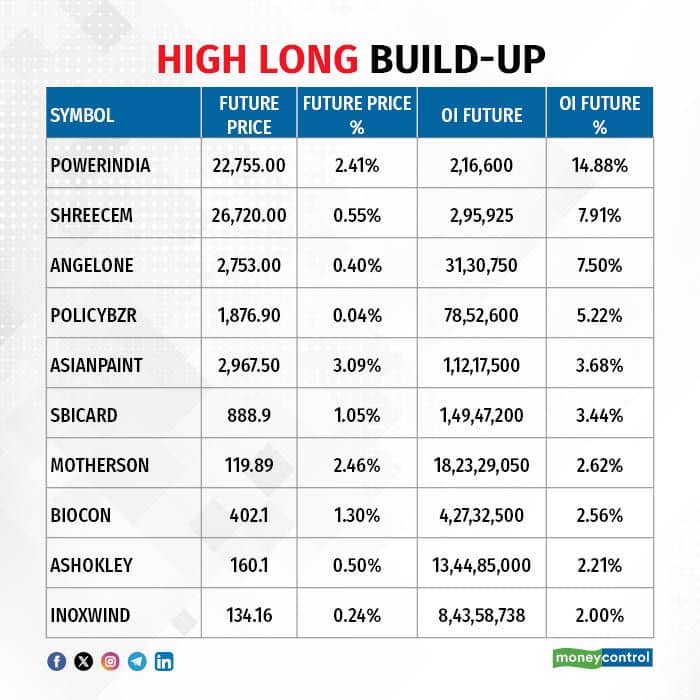
A long build-up was seen in 39 stocks. An increase in open interest (OI) and price indicates a build-up of long positions.
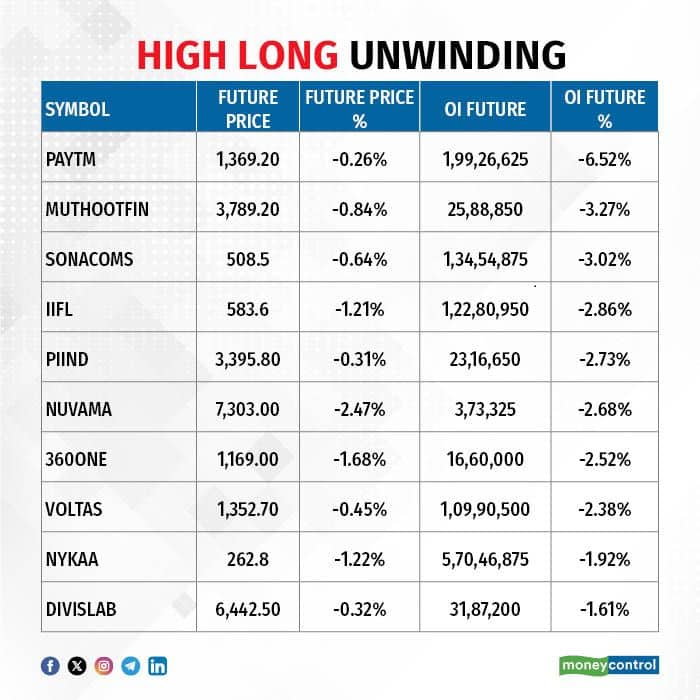
11) Long Unwinding (48 Stocks)
48 stocks saw a decline in open interest (OI) along with a fall in price, indicating long unwinding.
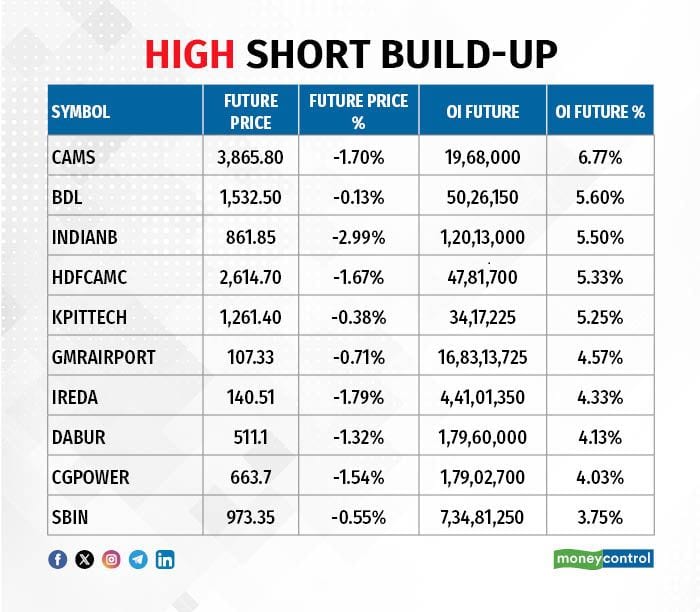
12) Short Build-up (85 Stocks)
85 stocks saw an increase in OI along with a fall in price, indicating a build-up of short positions.
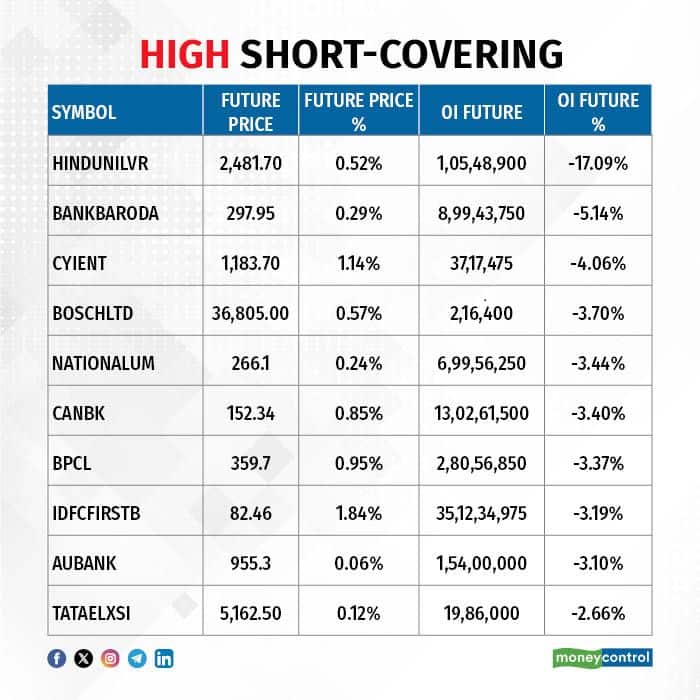
13) Short-Covering (39 Stocks)
39 stocks saw short-covering, meaning a decrease in OI, along with a price increase.
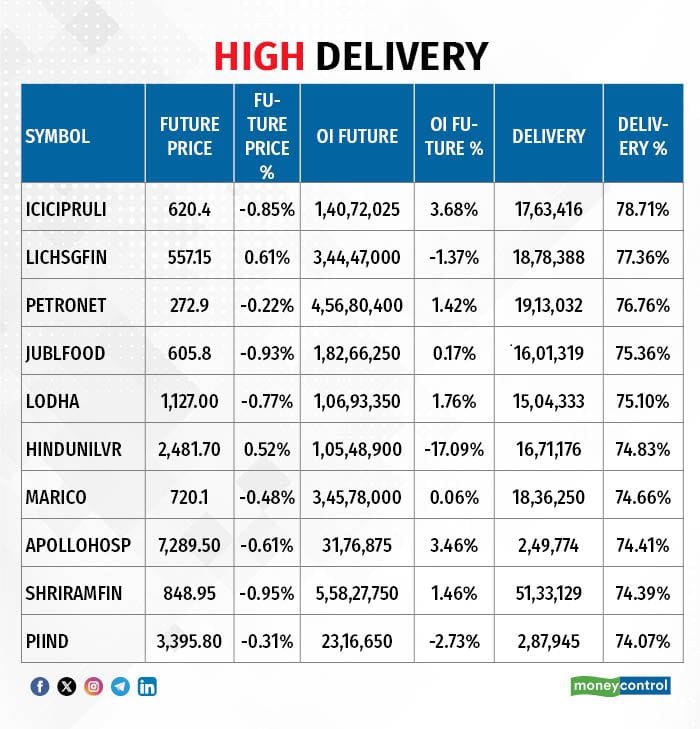
Here are the stocks that saw a high share of delivery trades. A high share of delivery reflects investing (as opposed to trading) interest in a stock.
Securities banned under the F&O segment include companies where derivative contracts cross 95 percent of the market-wide position limit.
Stocks added to F&O ban: Nil
Stocks retained in F&O ban: Sammaan Capital
Stocks removed from F&O ban: Nil
Disclaimer: The views and investment tips expressed by experts on Moneycontrol are their own and not those of the website or its management. Moneycontrol advises users to check with certified experts before taking any investment decisions.Disclaimer: Moneycontrol is a part of the Network18 group. Network18 is controlled by Independent Media Trust, of which Reliance Industries is the sole beneficiary.Discover the latest Business News, Sensex, and Nifty updates. Obtain Personal Finance insights, tax queries, and expert opinions on Moneycontrol or download the Moneycontrol App to stay updated!
Find the best of Al News in one place, specially curated for you every weekend.
Stay on top of the latest tech trends and biggest startup news.


