


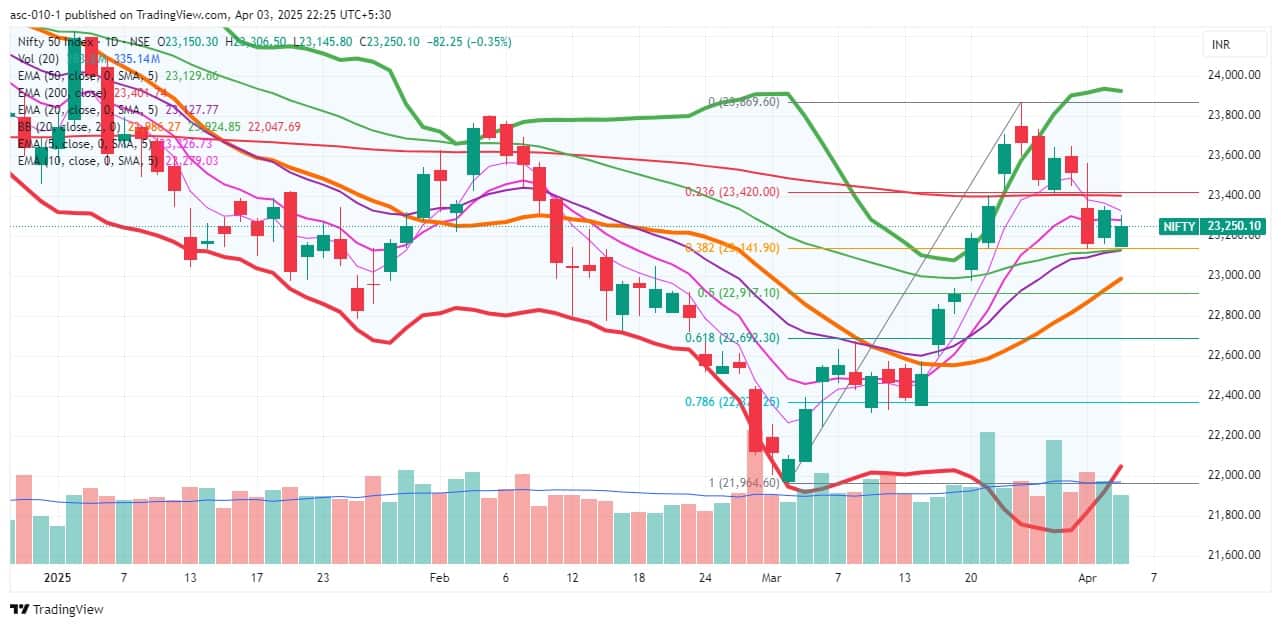
The Nifty 50 recovered 100 points from the day's low and closed with a 0.35 percent loss on April 3, after higher-than-expected tariffs were imposed by Donald Trump on several countries. The index continued to defend the 23,130 level (38.2 percent Fibonacci retracement and the 20 & 50-day EMA) for the third consecutive session, which is positive. As long as the index holds this level as support, an upward movement toward 23,800 is possible in the short term. However, in the near term, it may face immediate resistance at 23,400 (200-day EMA), followed by 23,650. Above this level, 23,800 could be achievable. On the other hand, breaking the support could drag the index down to the 23,000-22,900 zone, according to experts.
Here are 15 data points we have collated to help you spot profitable trades:
1) Key Levels For The Nifty 50 (23,250)
Resistance based on pivot points: 23,296, 23,333, and 23,395
Support based on pivot points: 23,173, 23,135, and 23,073
Special Formation: The Nifty 50 formed a bullish candlestick pattern with an upper shadow on the daily charts, as the closing was higher than the opening levels. This indicates rangebound movement with a weak bias. The index has still sustained in the upper band of Bollinger Bands and held above the 20 and 50-day EMAs, which is positive. The momentum indicators show that the RSI (Relative Strength Index) at 54.49 is tilted down, while the MACD (Moving Average Convergence Divergence) is still well above the zero line, maintaining a positive bias though also tilted downward.
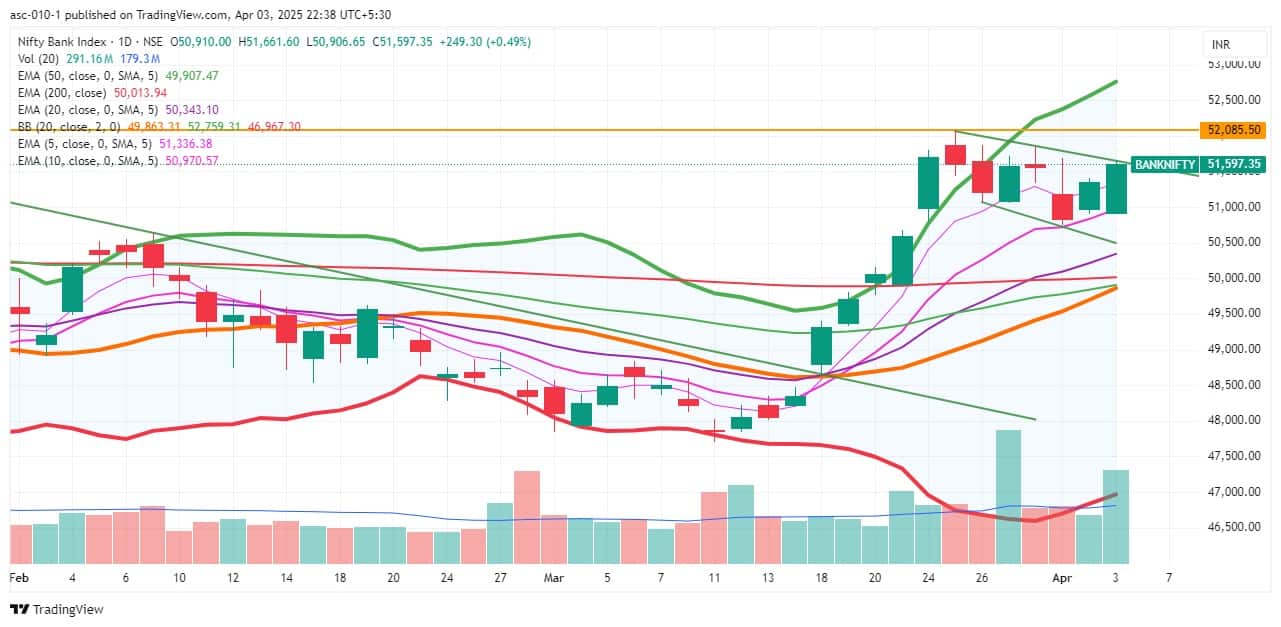
2) Key Levels For The Bank Nifty (51,597)
Resistance based on pivot points: 51,677, 51,855, and 52,144
Support based on pivot points: 51,100, 50,922, and 50,634
Resistance based on Fibonacci retracement: 51,883, 53,020
Support based on Fibonacci retracement: 50,430, 49,915
Special Formation: The Bank Nifty has sustained above all key moving averages (10, 20, 50, 100, and 200-day EMAs) and formed a long bullish candlestick pattern on the daily timeframe, accompanied by above-average volumes. In fact, all these EMAs are trending upward, which is positive, and the index is on the verge of a trendline breakout, rising by 0.5 percent.
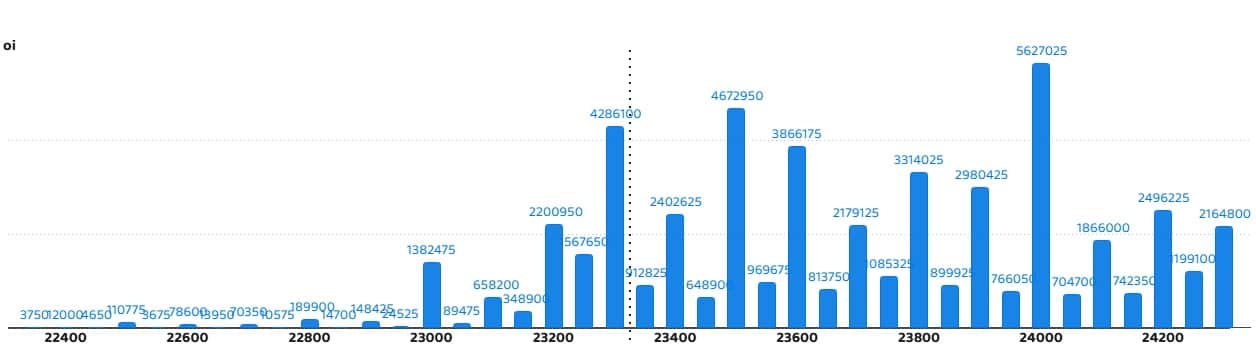
According to the weekly options data, the maximum Call open interest was seen at the 24,000 strike (with 56.27 lakh contracts). This level can act as a key resistance for the Nifty in the short term. It was followed by the 23,500 strike (46.72 lakh contracts), and the 23,300 strike (42.86 lakh contracts).
Maximum Call writing was observed at the 24,000 strike, which saw an addition of 31.87 lakh contracts, followed by the 23,300 and 23,600 strikes, which added 29.06 lakh and 25.96 lakh contracts, respectively. There was hardly any maximum Call unwinding seen in the 22,350-24,300 strike band.
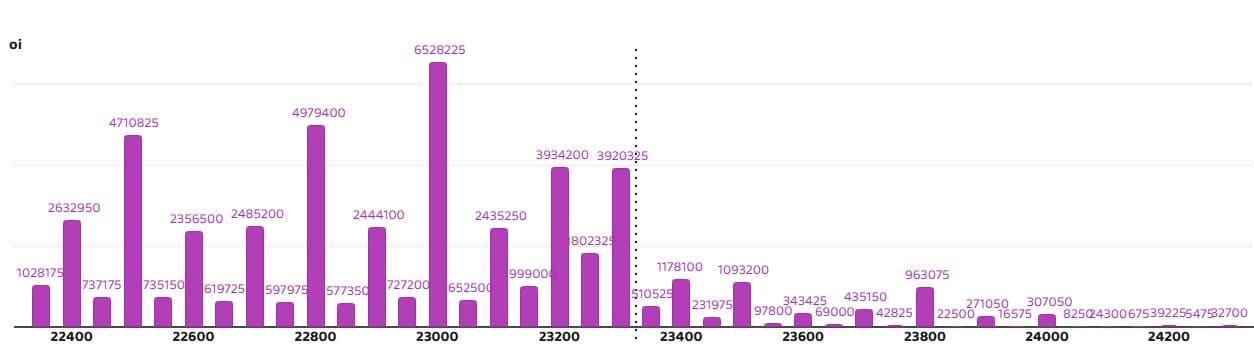
On the Put side, the 23,000 strike holds the maximum Put open interest (with 65.28 lakh contracts), which can act as a key support level for the Nifty. It was followed by the 22,800 strike (49.79 lakh contracts) and the 22,500 strike (47.1 lakh contracts).
The maximum Put writing was placed at the 22,800 strike, which saw an addition of 40.38 lakh contracts, followed by the 23,000 and 22,500 strikes, which added 34.36 lakh and 32.68 lakh contracts, respectively. The maximum Put unwinding was seen at the 23,600 strike, which shed 1.72 lakh contracts, followed by the 23,500 and 23,550 strikes, which shed 1.17 lakh and 38,025 contracts, respectively.
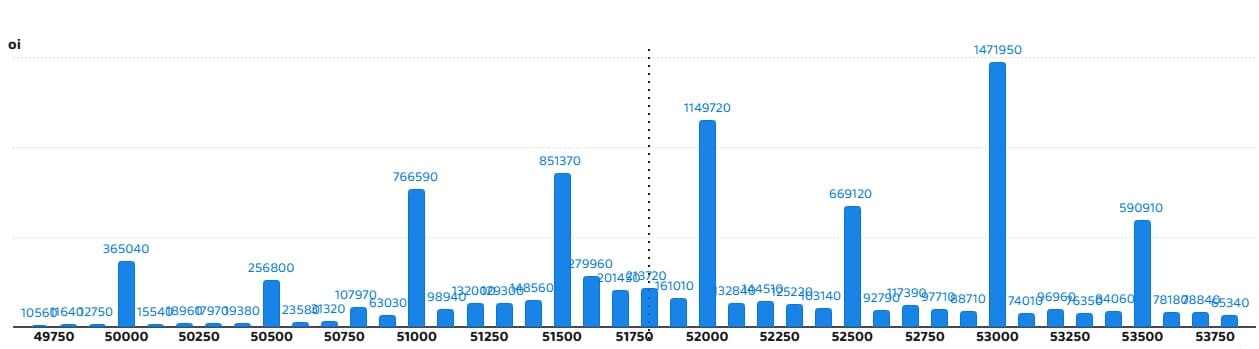
5) Bank Nifty Call Options Data
According to the monthly options data, the 53,000 strike holds the maximum Call open interest, with 14.71 lakh contracts. This can act as a key resistance level for the index in the short term. It was followed by the 52,000 strike (11.49 lakh contracts) and the 51,500 strike (8.51 lakh contracts).
Maximum Call writing was visible at the 53,000 strike (with the addition of 1.38 lakh contracts), followed by the 51,500 strike (1 lakh contracts) and the 51,600 strike (77,490 contracts). The maximum Call unwinding was seen at the 53,600 strike, which shed 29,010 contracts, followed by the 52,800 and 51,300 strikes, which shed 28,500 and 16,770 contracts, respectively.
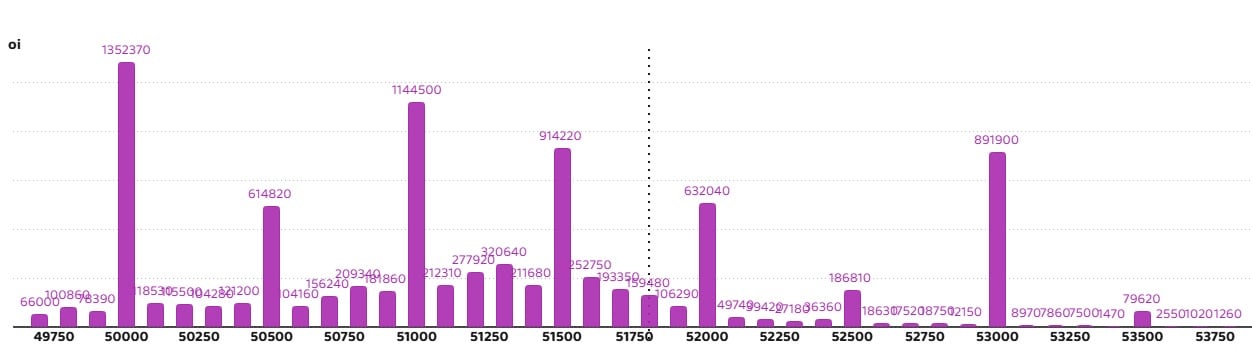
6) Bank Nifty Put Options Data
On the Put side, the maximum Put open interest was seen at the 50,000 strike (with 13.52 lakh contracts), which can act as a key support level for the index. This was followed by the 51,000 strike (11.44 lakh contracts) and the 51,500 strike (9.14 lakh contracts).
The maximum Put writing was observed at the 50,000 strike (which added 2.78 lakh contracts), followed by the 51,500 strike (2.38 lakh contracts) and the 51,000 strike (1.63 lakh contracts). The maximum Put unwinding was seen at the 53,000 strike, which shed 2.81 lakh contracts, followed by the 53,500 and 52,400 strikes, which shed 1,020 and 690 contracts, respectively.
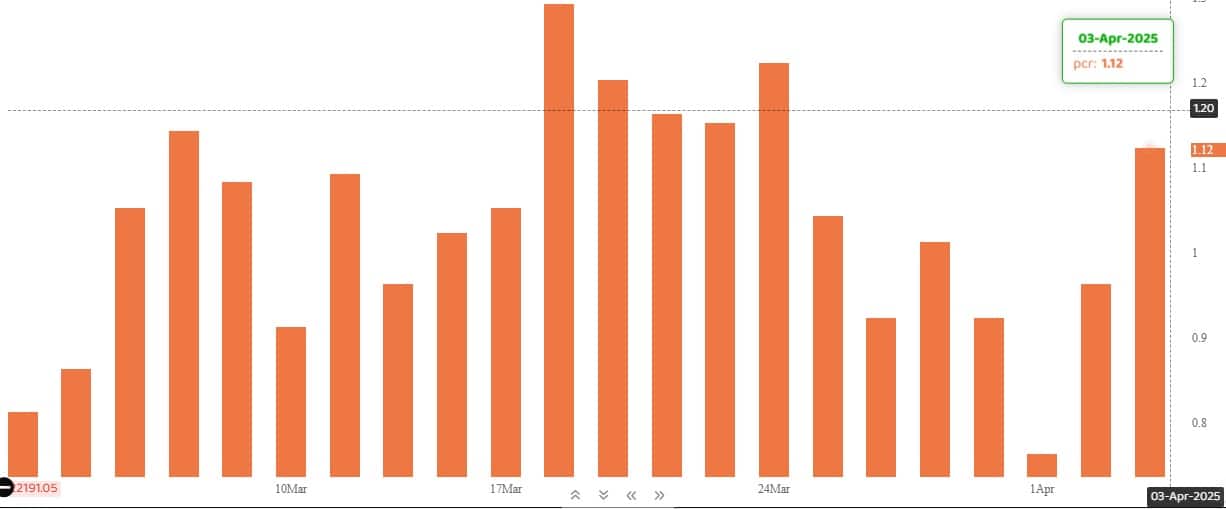
The Nifty Put-Call ratio (PCR), which indicates the mood of the market, jumped to 1.12 on April 3, against 0.96 in the previous session.
The increasing PCR, or being higher than 0.7 or surpassing 1, means traders are selling more Put options than Call options, which generally indicates the firming up of a bullish sentiment in the market. If the ratio falls below 0.7 or moves towards 0.5, then it indicates selling in Calls is higher than selling in Puts, reflecting a bearish mood in the market.
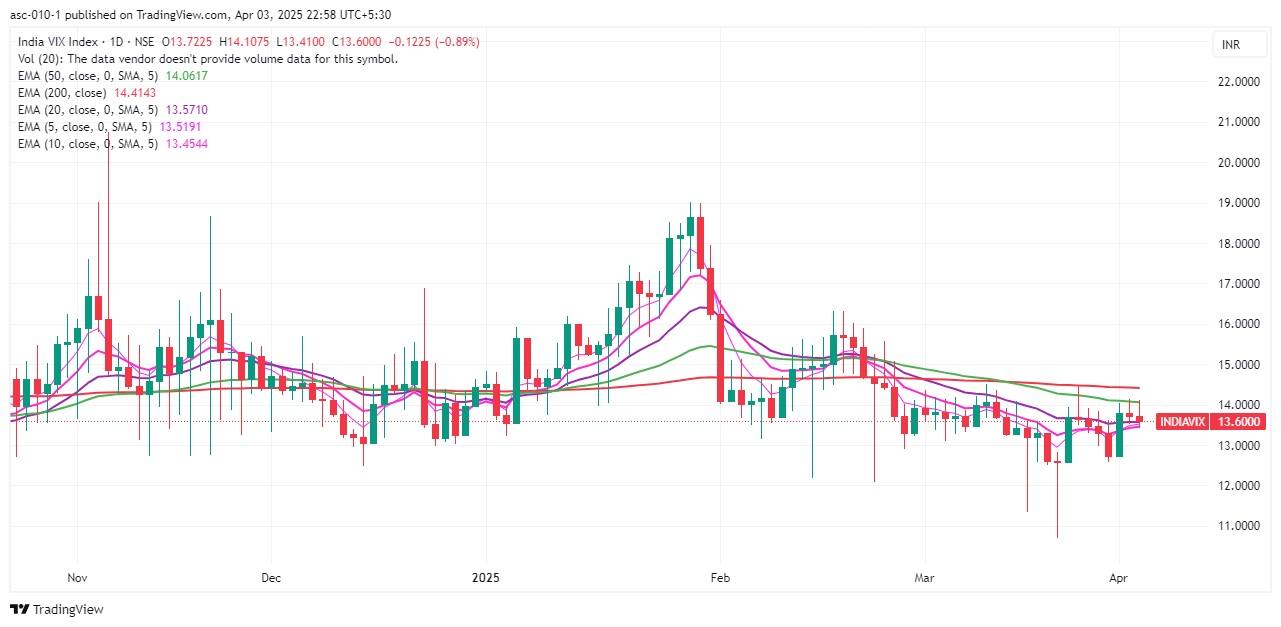
9) India VIX
The India VIX, the fear gauge, extended its downtrend for another session, falling by 0.89 percent to the 13.60 level. However, the index still remains above short-term moving averages (5, 10, and 20-day EMAs), which makes the bulls a bit uncomfortable.
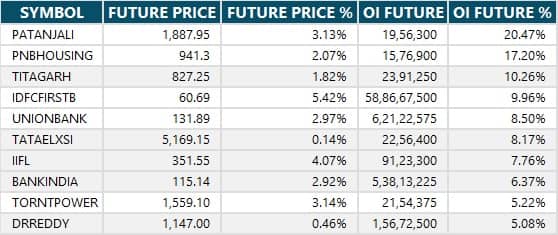
A long build-up was seen in 77 stocks. An increase in open interest (OI) and price indicates a build-up of long positions.
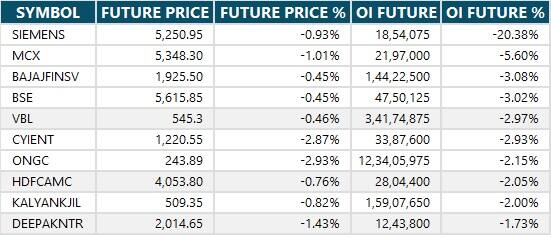
11) Long Unwinding (41 Stocks)
41 stocks saw a decline in open interest (OI) along with a fall in price, indicating long unwinding.
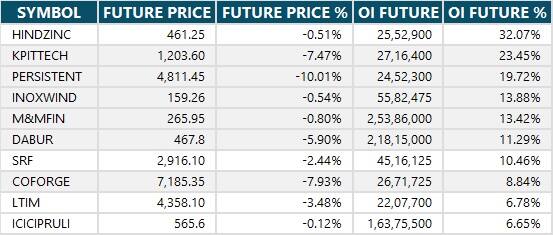
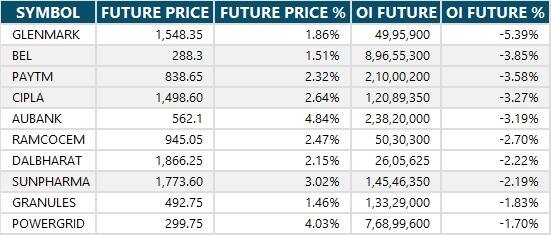
12) Short Build-up (54 Stocks)
54 stocks saw an increase in OI along with a fall in price, indicating a build-up of short positions.
13) Short-Covering (49 Stocks)
49 stocks saw short-covering, meaning a decrease in OI, along with a price increase.
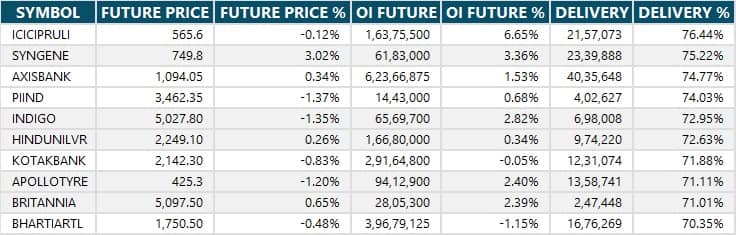
Here are the stocks that saw a high share of delivery trades. A high share of delivery reflects investing (as opposed to trading) interest in a stock.
Securities banned under the F&O segment include companies where derivative contracts cross 95 percent of the market-wide position limit.
Stocks added to F&O ban: Nil
Stocks retained in F&O ban: Nil
Stocks removed from F&O ban: Nil
Disclaimer: The views and investment tips expressed by experts on Moneycontrol are their own and not those of the website or its management. Moneycontrol advises users to check with certified experts before taking any investment decisions.Disclosure: Moneycontrol is a part of the Network18 group. Network18 is controlled by Independent Media Trust, of which Reliance Industries is the sole beneficiary.Discover the latest Business News, Sensex, and Nifty updates. Obtain Personal Finance insights, tax queries, and expert opinions on Moneycontrol or download the Moneycontrol App to stay updated!
Find the best of Al News in one place, specially curated for you every weekend.
Stay on top of the latest tech trends and biggest startup news.


