


The Nifty 50 bounced back after a day of sharp correction, recovering nearly half of its previous day's losses while taking support at the 38.2% Fibonacci retracement level (from the March low to the high of 23,142). The index closed 0.72% higher on April 2, ahead of the fresh tariffs set to be imposed by the Trump administration. Donald Trump announced a 25% tariff on all foreign-made automobiles, and a 26% discounted reciprocal tax on India. Experts caution that some volatility cannot be ruled out following this event. According to analysts, a decisive break below 23,142 could drag the index down toward the 23,000–22,900 range. However, if the index defends this level on a closing basis, an upward move toward the 23,500–23,650 zone remains possible in the upcoming sessions.

Here are 15 data points we have collated to help you spot profitable trades:
1) Key Levels For The Nifty 50 (23,332)
Resistance based on pivot points: 23,353, 23,399, and 23,472
Support based on pivot points: 23,207, 23,162, and 23,089
Special Formation: The Nifty 50 formed a bullish candlestick pattern, resembling an inside bar or a Bullish Hammer-like pattern (though not a classical one) on the daily charts, which indicates a potential trend reversal. Confirmation of this pattern may be seen in the following session. Momentum indicators further support this view as the Relative Strength Index (RSI) is trending upward at 56.82, and the Moving Average Convergence Divergence (MACD) remains well above the zero line, maintaining a positive bias.
2) Key Levels For The Bank Nifty (51,348)
Resistance based on pivot points: 51,410, 51,527, and 51,716
Support based on pivot points: 51,031, 50,914, and 50,724
Resistance based on Fibonacci retracement: 51,883, 53,020
Support based on Fibonacci retracement: 50,398, 49,883
Special Formation: The Bank Nifty also formed a bullish candlestick pattern on the daily timeframe, exhibiting a higher low formation while sustaining above all key moving averages (10, 20, 50, 100, and 200-day EMAs). The RSI climbed above the 60 zone to 63.83, and the MACD remains in positive territory, holding above the zero line.

According to the weekly options data, the 23,500 strike holds the maximum Call open interest (with 1.48 crore contracts). This level can act as a key resistance for the Nifty in the short term. It was followed by the 23,300 strike (1.14 crore contracts), and the 24,000 strike (1.02 crore contracts).
Maximum Call writing was observed at the 23,300 strike, which saw an addition of 40.69 lakh contracts, followed by the 23,350 and 23,500 strikes, which added 37.54 lakh and 14.76 lakh contracts, respectively. The maximum Call unwinding was seen at the 24,650 strike, which shed 15.96 lakh contracts, followed by the 23,200 and 24,150 strikes, which shed 12.84 lakh and 11.37 lakh contracts, respectively.

On the Put side, the maximum Put open interest was seen at the 23,000 strike (with 1.17 crore contracts), which can act as a key support level for the Nifty. It was followed by the 23,200 strike (1.13 crore contracts) and the 23,300 strike (90.19 lakh contracts).
The maximum Put writing was placed at the 23,200 strike, which saw an addition of 63.72 lakh contracts, followed by the 23,300 and 23,000 strikes, which added 54.5 lakh and 42.89 lakh contracts, respectively. The maximum Put unwinding was seen at the 22,800 strike, which shed 7.31 lakh contracts, followed by the 23,500 and 23,600 strikes, which shed 7.25 lakh and 4.83 lakh contracts, respectively.

5) Bank Nifty Call Options Data
According to the monthly options data, the maximum Call open interest was seen at the 53,000 strike, with 13.33 lakh contracts. This can act as a key resistance level for the index in the short term. It was followed by the 52,000 strike (10.84 lakh contracts) and the 51,500 strike (7.51 lakh contracts).
Maximum Call writing was visible at the 52,000 strike (with the addition of 1.26 lakh contracts), followed by the 51,300 strike (46,680 contracts) and the 51,200 strike (45,270 contracts). The maximum Call unwinding was seen at the 52,500 strike, which shed 71,820 contracts, followed by the 51,000 and 50,800 strikes, which shed 54,420 and 35,610 contracts, respectively.

6) Bank Nifty Put Options Data
On the Put side, the 53,000 strike holds the maximum Put open interest (with 11.73 lakh contracts), which can act as a key level for the index. This was followed by the 50,000 strike (10.73 lakh contracts) and the 51,000 strike (9.81 lakh contracts).
The maximum Put writing was observed at the 51,000 strike (which added 1.99 lakh contracts), followed by the 50,000 strike (1.53 lakh contracts) and the 51,200 strike (1.36 lakh contracts). The maximum Put unwinding was seen at the 53,000 strike, which shed 66,390 contracts, followed by the 52,300 and 50,600 strikes, which shed 29,790 and 12,900 contracts, respectively.


The Nifty Put-Call ratio (PCR), which indicates the mood of the market, climbed to 0.96 on April 2, against 0.76 in the previous session.
The increasing PCR, or being higher than 0.7 or surpassing 1, means traders are selling more Put options than Call options, which generally indicates the firming up of a bullish sentiment in the market. If the ratio falls below 0.7 or moves towards 0.5, then it indicates selling in Calls is higher than selling in Puts, reflecting a bearish mood in the market.

9) India VIX
The India VIX, which measures expected market volatility, declined slightly by 0.44% to 13.72. However, it continues to sustain above short-term moving averages (5, 10, and 20-day EMAs), which could be a cause for concern for bulls.

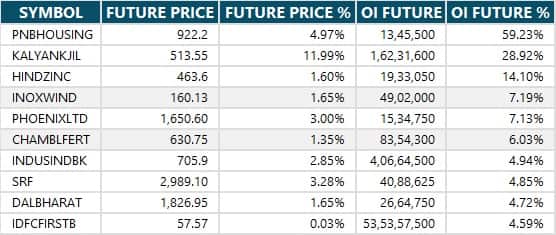
A long build-up was seen in 77 stocks. An increase in open interest (OI) and price indicates a build-up of long positions.
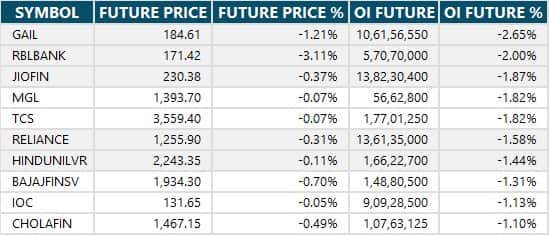
11) Long Unwinding (19 Stocks)
19 stocks saw a decline in open interest (OI) along with a fall in price, indicating long unwinding.
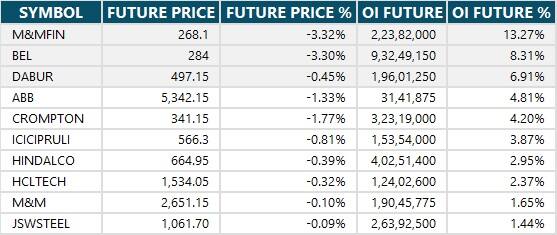
12) Short Build-up (17 Stocks)
17 stocks saw an increase in OI along with a fall in price, indicating a build-up of short positions.
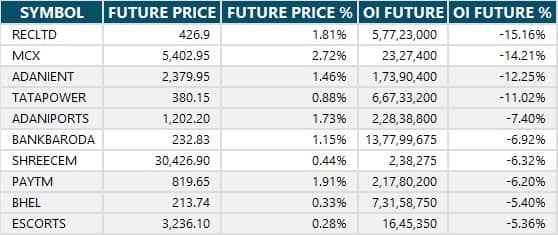
13) Short-Covering (109 Stocks)
109 stocks saw short-covering, meaning a decrease in OI, along with a price increase.
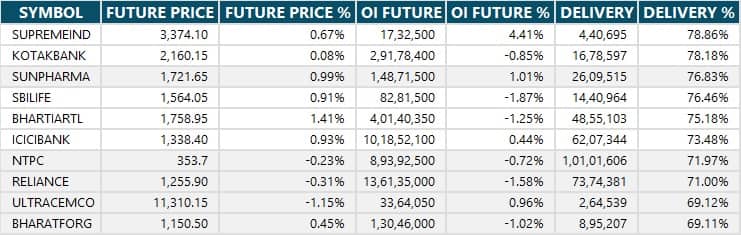
Here are the stocks that saw a high share of delivery trades. A high share of delivery reflects investing (as opposed to trading) interest in a stock.
Securities banned under the F&O segment include companies where derivative contracts cross 95 percent of the market-wide position limit.
Stocks added to F&O ban: Nil
Stocks retained in F&O ban: Nil
Stocks removed from F&O ban: Nil
Disclaimer: The views and investment tips expressed by experts on Moneycontrol are their own and not those of the website or its management. Moneycontrol advises users to check with certified experts before taking any investment decisions.Disclosure: Moneycontrol is a part of the Network18 group. Network18 is controlled by Independent Media Trust, of which Reliance Industries is the sole beneficiary.Discover the latest Business News, Sensex, and Nifty updates. Obtain Personal Finance insights, tax queries, and expert opinions on Moneycontrol or download the Moneycontrol App to stay updated!


Find the best of Al News in one place, specially curated for you every weekend.
Stay on top of the latest tech trends and biggest startup news.


