


Chandan Taparia
Today, we shall be discussing about Shooting Star and Inverted Hammer candles.
Inverted Hammer and Shooting Star are reversal patterns which comprise one candle only. Both patterns have the same shape: candlestick with long upper shadows and small real bodies. The upper shadow should be at least two times longer than the body.
There should be no lower shadow or a very small lower shadow. The colour of the body is not significant. However a white or blue body has slightly more bullish implications. A red or black body has slightly more bearish implications.
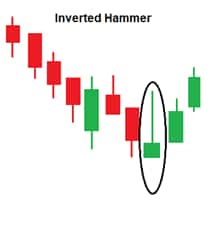
Inverted Hammer (bullish pattern)
Inverted Hammer is a bottom reversal pattern and is formed at the end of a downtrend or during a pullback within an uptrend or at the support. To form an Inverted Hammer candle, the price should trade much higher than where it opened and then it drops to close near the day's low. The long upper shadow formed shows some indications that the buyers might have started to step in.
Although the sellers or bears managed to regain control and drive the price lower at close, the appearance of buying interest gives some warnings or early sign to bears. The next trading session needs to confirm the bullish reversal signal with a strong Bullish Day.
In nutshell, the trend is facing pressure and formation of the candle suggests an early sign that bulls are back in the system. The follow-up confirms end of the decline and a short term price reversal.
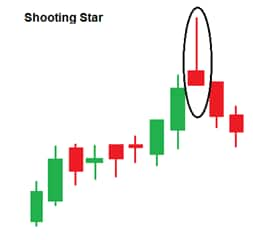
Shooting Star (bearish pattern)Shooting Star is a top reversal or bearish reversal pattern. Normally, it occurs at the end of an uptrend or during a bounce within a downtrend or at the resistance. To form this pattern in the middle of a strong rally, price opens higher and rises sharply, but towards the end of the session it reverses and closes near the day's low.
The following day needs to confirm this with a strong bearish day. In nutshell, the trend is up but formation of this candle suggests an early sign that bears are now started to fight and follow up selling could confirms the end of the up move and a short term price reversal.
Disclaimer: The author is Associate Vice President | Analyst-Derivatives at Motilal Oswal Financial Services. The views and investment tips expressed by experts on moneycontrol.com are their own and not that of the website or its management. Moneycontrol.com advises users to check with certified experts before taking any investment decisions.

Discover the latest Business News, Sensex, and Nifty updates. Obtain Personal Finance insights, tax queries, and expert opinions on Moneycontrol or download the Moneycontrol App to stay updated!
Find the best of Al News in one place, specially curated for you every weekend.
Stay on top of the latest tech trends and biggest startup news.


