


An ongoing tariff war between the US and China has left its mark on Wall Street, triggering a wave of panic selling and creating ripples across global equity and commodity markets. The 34 percent tariff retaliation from China on the US has caught the attention of investors worldwide, sending the markets into a temporary tailspin. However, while the short-term outlook may seem uncertain, there is reason to believe that the markets will regain their footing, riding on the strength of historical patterns and strategic technical indicators.
Earlier, on March 23, 2025, we made a bold call on MoneyControl, predicting a bearish phase between March 27 and April 2 based on Fibonacci Time Cycles. At that time, markets were still in a bullish uptrend, with the Nifty50 soaring nearly 1,800 points, from 22,000 to 23,869 levels. Bang on with the market moves, but What’s Next for the Market?
A Peek Into the Trend Identification
When determining market trends, one of the most effective tools used by technical analysts is the Golden Cross and Death Cross theory. For the uninitiated, the Golden Cross occurs when a short-term moving average (typically 50 days) crosses above a long-term moving average (typically 200 days), signalling a potential bullish trend. Conversely, the Death Cross is the opposite: a short-term moving average falling below a long-term moving average, often interpreted as a bearish signal.
Currently, we are witnessing an uptick in the number of stocks falling into the Death Cross category, signalling a market that’s tilting toward a bearish tone.
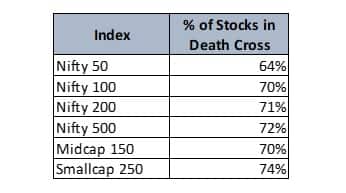
The Nifty50 index reveals that out of 50 stocks, a staggering 32 stocks (64 percent) are in a bearish trend. When analysing the broader Nifty 500, this number rises to a troubling 72 percent. The Midcap 150 and Smallcap 250 indices are also heavily weighted in the red, with over 70 percent of stocks showing bearish momentum.
However, despite these bearish signals, there’s still a silver lining. Historically, the market has demonstrated a ray of hope even in the face of such intense selling pressure, and this could mark the beginning of a potential shift.
Nifty50: A Snapshot of the Short-Term and Long-Term
Looking at the Nifty50 index on a daily chart, the recent market movement tells a tale of both hope and caution.
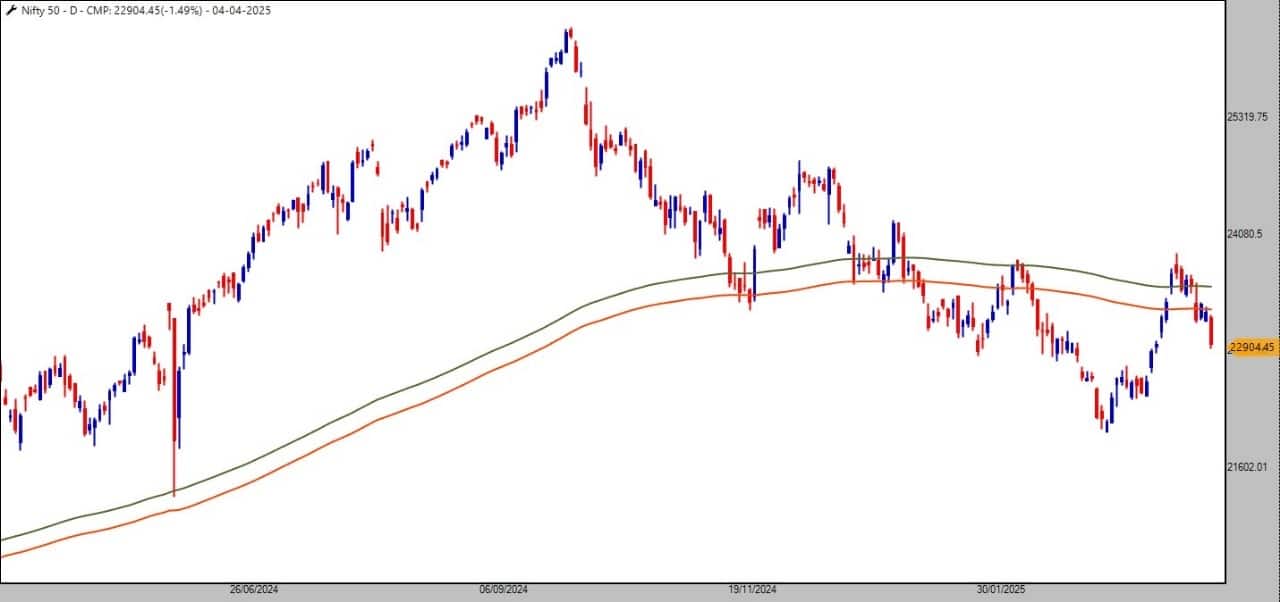
The index is trending in a Death Cross, only to experience a sharp pullback to 23,869, but eventually dropped below the 23,000 mark. The index faced resistance at the 200-day EMA channel, indicating a potential bull trap and a bearish trend. The index is now approaching the critical 61.80 percent Fibonacci retracement level at 22,692 and 22,371 at 78.60 percent levels which may potential act as a support zone and provide the necessary foundation for a market rebound.
But what about the long-term outlook?
A closer look at the weekly chart reveals a more promising picture.
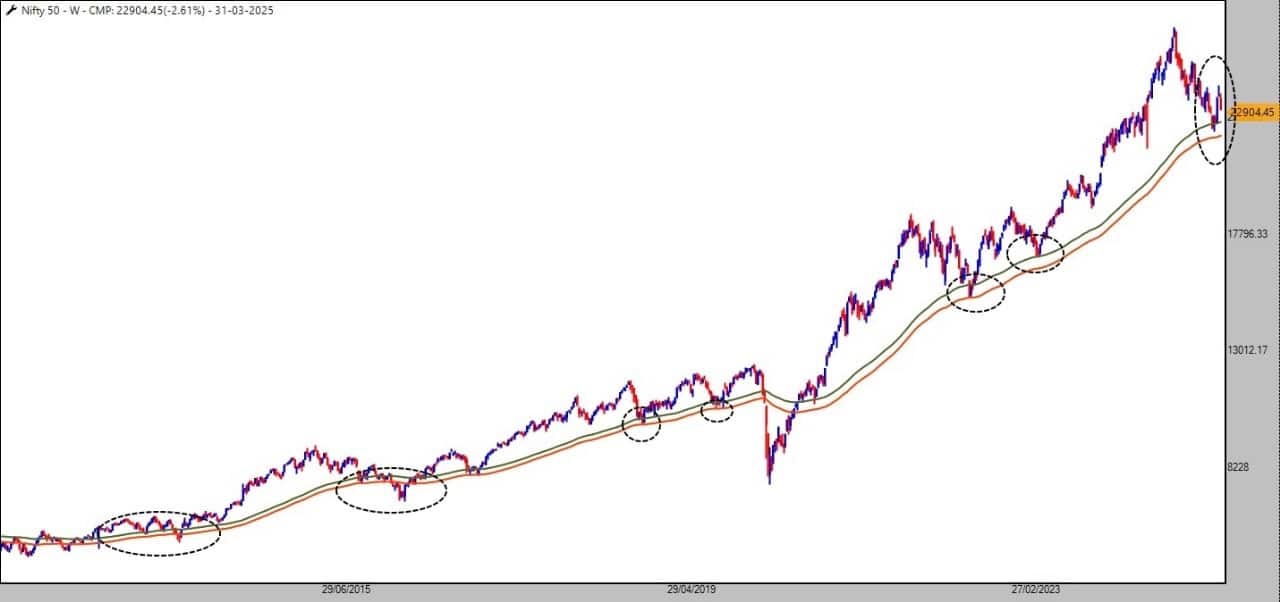
The 100-week exponential moving average (WEMA) has been a reliable support zone for Nifty50 since 2013. This moving average channel, created by the 100WEMA (High) and 100WEMA (Low), has acted as a consistent demand zone in the past, and history has a way of repeating itself. If this support zone holds once again, it could signal a market turnaround.
Optimism Amidst Bearish Sentiment
While short-term market fluctuations and technical indicators may paint a bearish picture, it’s essential to remember that markets are cyclical. The current bearish momentum is no exception. The Nifty50, along with the broader Nifty 500 index, is experiencing a short-term phase of downward pressure. Yet, this phase is unlikely to last forever.
What’s encouraging is the presence of solid long-term support levels, such as the 100WEMA channel on the weekly chart. This has historically provided a strong foundation for the index, enabling it to recover from past market setbacks. If this historical trend persists, the Nifty50 could regain its footing and resume its upward trajectory in the near future.
For investors, this period of uncertainty offers a unique opportunity to analyse the market with a longer-term perspective. While caution is necessary in the short term, historical evidence suggests that this could be a temporary setback rather than the start of a prolonged downturn.
Note: The purpose of this article is only to share interesting charts, data points and thought-provoking opinions. It is NOT a recommendation. This article is strictly for educative purposes only.Disclaimer: The views and investment tips expressed by experts on Moneycontrol are their own and not those of the website or its management. Moneycontrol advises users to check with certified experts before taking any investment decisions.
Discover the latest Business News, Sensex, and Nifty updates. Obtain Personal Finance insights, tax queries, and expert opinions on Moneycontrol or download the Moneycontrol App to stay updated!
Find the best of Al News in one place, specially curated for you every weekend.
Stay on top of the latest tech trends and biggest startup news.


