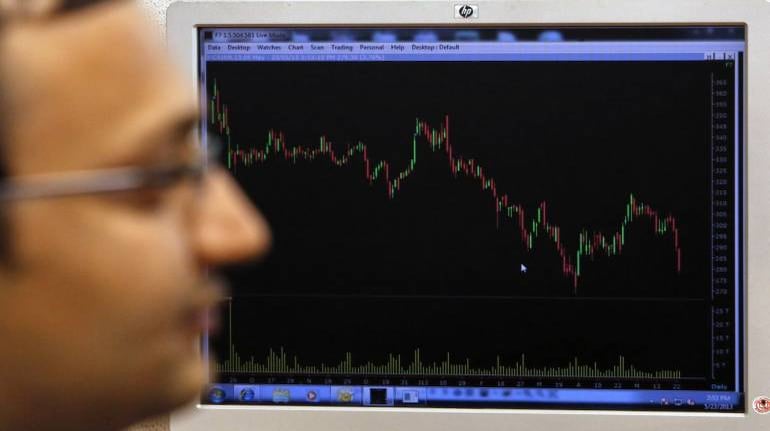


Gaps result from extraordinary buying or selling interest developing while the market is closed.
On a technical analysis chart, a gap represents an area where no trading has taken place. Gaps once identified on a price chart can be used for successful trading with excellent risk-reward ratio.
Trading with Bullish Measuring GapMeasuring gaps are formed during the continuation of a rally and are called ‘continuation gap’. This gap gives good trading opportunities particularly if the measuring gap has come after a breakaway gap. Breakaway gaps occur when the price action is breaking out of a trading range or a congestion area.
Steps for calculating stop loss & target while adding long position with measuring gaps:1. Note down the breakaway gap which is just below measuring gap.
2. Calculate the mid-point of breakaway gap.
3. Calculate the mid-point of measuring gap.
4. Find difference between the mid-point of the breakaway gap and the mid-point of the measuring gap, which is called as ‘target points’.
5. To find out the final target, add target points to mid-point of measuring gap.
6. Stop loss is calculated as a low of measuring gap and hence trading measuring gap gives very high risk reward ratio.

This gap gives a good trading opportunity. One can use advanced trading methods mentioned below to get higher gains.
Steps for calculating stop loss and target while short selling with measuring gap are given below:
1. Note down the breakaway gap which is just above measuring gap.
2. Calculate the mid-point of breakaway gap.
3. Calculate the mid-point of measuring gap.
4. Find he difference between the mid-point of the breakaway gap and the mid-point of measuring gap, which is called as ‘target points’.
5. To fine out the final target, subtract target points from mid-point of measuring gap.
6. Stop loss is calculated as a high of measuring gap and hence trading measuring gap gives a very high risk reward ratio too.
Trading with Bearish Island reversalAn island reversal is a pattern composed of a gap in the trending direction, a mostly sideways period for the price, then a gap in the other direction. The price does not return to where the sideways period occurred, making it look like an island on the chart. First gap can be termed as an exhaustion gap and second gap can be a breakaway or common gap.
In terms of bearish island reversal, one can short sell just below island keeping high of second gap as a stop loss whereas target is second gap subtracted by size of island. Size of island is calculated by subtracting highest high above both gaps minus upper level of second bearish gap.

In terms of bullish island reversal, one can buy just above island keeping low of second gap as a stop loss, whereas target is second gap subtracted by the size of the island. The size of the island is calculated by subtracting the lowest low below both gaps minus the lower level of second bullish gap.
Conclusion> Gaps are a significant technical development in price action and chart analysis, and should not be ignored.
> Trading with measuring gaps gives the finest trading opportunity whereas it also provides a very high risk reward ratio.
> Gaps can play an important role when spotted before the beginning of a move.
(The author is a Head - Technical & Derivative Research, Narnolia Financial Advisors)Disclaimer: The views and investment tips expressed by investment expert on Moneycontrol.com are his own and not that of the website or its management. Moneycontrol.com advises users to check with certified experts before taking any investment decisions.Discover the latest Business News, Sensex, and Nifty updates. Obtain Personal Finance insights, tax queries, and expert opinions on Moneycontrol or download the Moneycontrol App to stay updated!
Find the best of Al News in one place, specially curated for you every weekend.
Stay on top of the latest tech trends and biggest startup news.