


The market managed to end with half-a-percent gains in the week ended October 13. The Nifty50 made a bullish candlestick pattern with upper and lower shadows on the weekly scale after forming a hammer in the previous week.
For a further up-move, the index needs to close above a bearish gap created on September 21 in the 19,850-19,900 zone for a move towards the 20,000 mark, whereas on the lower side, the immediate support will be at 19,600, followed by 19,500, experts said, adding that the hammer's low of around 19,300, which coincides with a 20-week EMA (exponential moving average), will be a crucial support.
The Nifty50 settled at 19,751, gaining nearly 100 points for the week, while on Friday, it was down 43 points, but recovered more than 100 points from the day's low and defended the 20-day EMA of 19,685.
"It is essential for the bulls to convincingly surpass this crucial level of around 19,880, or else there might be the formation of a lower top on the daily chart, potentially leading to near-term weakness," Sameet Chavan, research head for technical and derivatives at Angel One, said.
On the flip side, while there was a willingness to buy on dips during the last week, caution is advised due to ongoing geopolitical concerns, and aggressive long bets should be avoided overnight, he said.
He feels the next market direction will depend on global developments and the quarterly earnings announcements of market heavyweights. "Traders should keep an eye on specific levels to assess the trend. Key support levels for the week are at 19,600 and 19,480, while formidable barriers are set at 19,880 and 20,000," Sameet said.
For the current week, Jigar S Patel, senior manager for equity research at Anand Rathi, also feels that on the upside, 19,900 might be the next trigger for the bulls. A move above this might pull the index back to an all-time high, he said.
Traders are strictly advised to hedge their long positions since any escalation in the ongoing geopolitical crisis might reverse the markets without any intimation, he advised.
Let's take a look at the top 10 trading ideas by experts for the next three-four weeks. Returns are based on the October 13 closing prices:
Expert: Viraj Vyas, CMT, technical & derivatives analyst| institutional equity at Ashika Stock Broking
Tata Consumer Products: Buy | LTP: Rs 913 | Stop-Loss: Rs 865 | Target: Rs 1,025 | Return: 12 percent
The stock embarked on a robust upswing from its May 2020 lows, surging from Rs 240 to Rs 900. However, in September 2021, the stock transitioned into a phase of time and price correction. This correction persisted until last Friday when the stock broke above its previous all-time high with notable price intensity and strong volume action.
This breakout suggests that the stock is poised to initiate the next leg of its bullish up-move, potentially targeting Rs 1,020-1,030 zone.

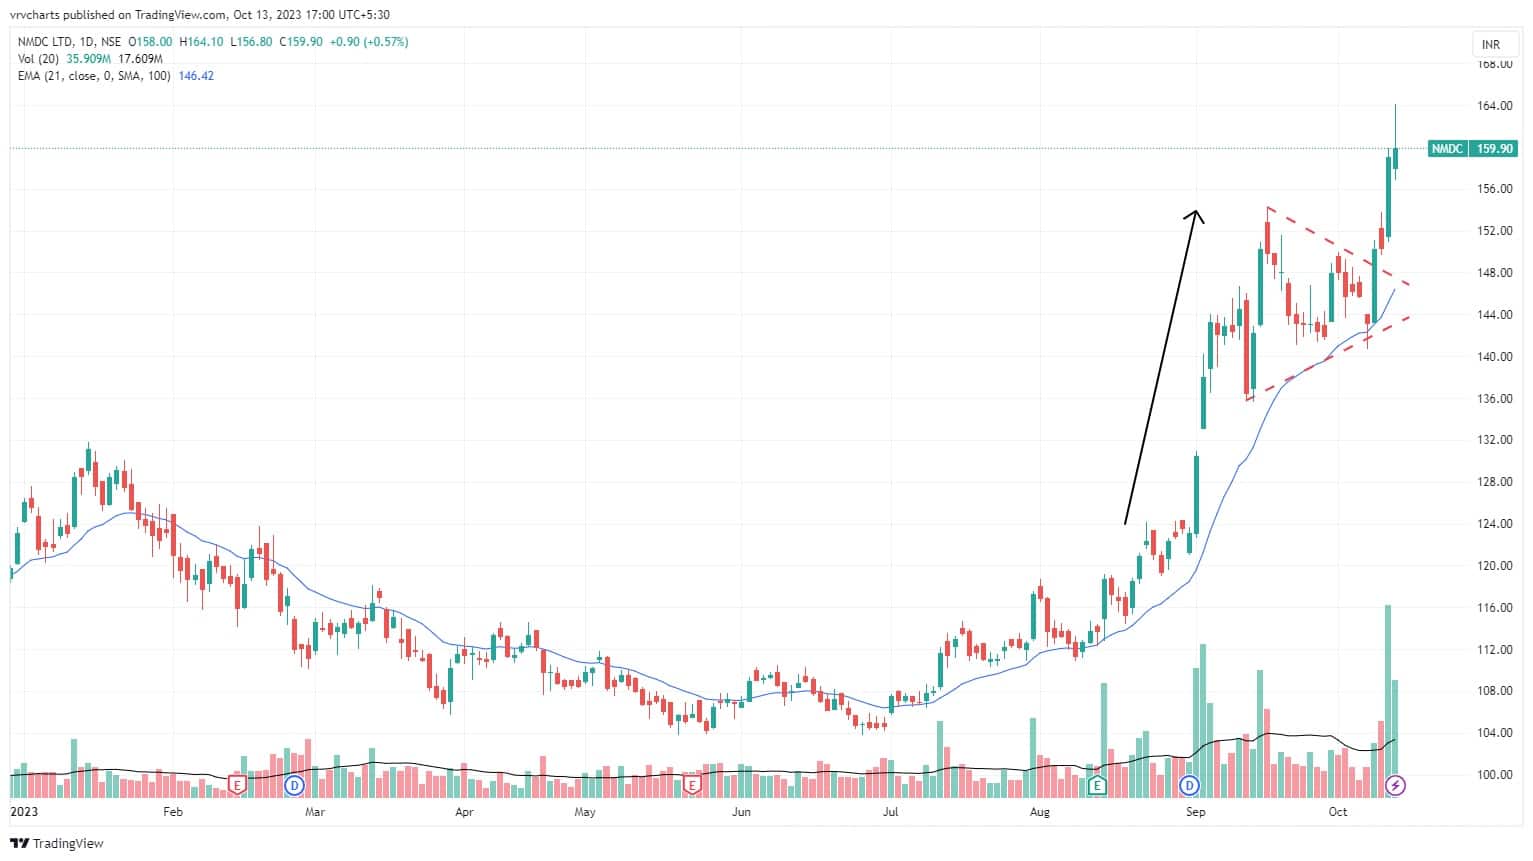
NMDC: Buy | LTP: Rs 160 | Stop-Loss: Rs 152 | Target: Rs 180 | Return: 12.5 percent
The stock has undergone significant time and price correction over the past nine years, with the upper resistance boundary at Rs 143. Recently, the stock initiated an impulsive move when it rallied from Rs 120 to Rs 152. It then began forming a Flag and Pole pattern, indicating a potential continuation of the uptrend.
The stock broke above the trendline at Rs 148, confirming not only a short-term pattern breakout but also a larger pattern breakout.
Metropolis Healthcare: Buy | LTP: Rs 1,558 | Stop-Loss: Rs 1,480 | Target: Rs 1,745 | Return: 12 percent
The stock, once a darling in the healthcare sector during the COVID-19 rally, experienced a significant downturn in 2022. It saw a sharp decline from its peak of Rs 3,500 to approximately Rs 1,200 in 2023. Since then, the stock has been forming a Cup and Handle pattern, typically indicating accumulation.
The breakout from this pattern was supported by high trading volumes. As long as the stock maintains its position above Rs 1,490-level, the bullish sentiment is likely to continue.

Expert: Shrikant Chouhan, head of equity research (retail) at Kotak Securities
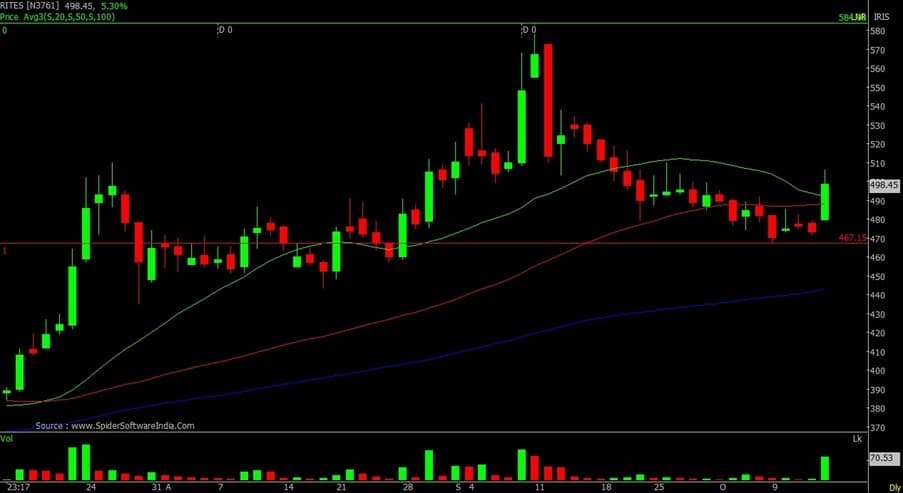
RITES: Buy | LTP: Rs 498 | Stop-Loss: Rs 474 | Target: Rs 520-555 | Return: 11 percent
The stock was falling consistently after leaving the support of Rs 555. In the last week, it stood at Rs 467, however, on Friday, due to a recovery in railway shares, the stock moved upwards and crossed 50 and 20-day SMA (simple moving average).
The key oscillators are on the verge of leaving the oversold zone, which could generate a buy signal to retrace the recent selloff. Buy with stop-loss at Rs 474, while resistance will be Rs 520 and Rs 555.
FDC: Buy | LTP: Rs 385 | Stop-Loss: Rs 365 | Target: Rs 430-450 | Return: 17 percent
Based on technical analysis, it appears that the stock has completed a corrective pattern at Rs 361 and established a higher bottom at Rs 370. Additionally, it has broken through the falling trendline at Rs 385, which may help the stock to move towards its previous highest level of Rs 430.
We believe that this is a continuation pattern for the stock that may lead to a rally beyond Rs 430 levels. Therefore, it is advisable to buy the stock at the current levels with a stop-loss set at Rs 365.
It is worth noting that there is resistance at Rs 430 and Rs 450 levels. Buy the stock at the current levels with a stop-loss set at Rs 365. It is worth noting that there is resistance at Rs 430 and Rs 450 levels.

Macrotech Developers: Buy | LTP: Rs 810 | Stop-Loss: Rs 770 | Target: Rs 850-890 | Return: 10 percent
The stock is currently showing an ascending triangle formation, with its levels staying below Rs 820. Over a weekly and monthly basis, the stock has spent a significant amount of time above Rs 765 levels. In case it breaches Rs 820 levels, it has the potential to reach Rs 850 and Rs 890 levels quite quickly.
Based on the technical formation, the sector is outperforming and might support bullish break-out formations. Our recommendation would be to buy the stock between Rs 820 and Rs 800 levels while keeping a stop-loss at Rs 770.

Expert: Mitesh Karwa, research analyst at Bonanza Portfolio
Sobha: Buy | LTP: Rs 762 | Stop-Loss: Rs 690 | Target: Rs 867 | Return: 14 percent
Sobha has seen breaking out of a bullish pattern on the weekly timeframe with above average volumes. In addition, the stock is trading above important EMAs of 20/50/100/200 (exponential moving averages) on the daily timeframe which indicates strength.
On the indicator front, momentum oscillator RSI (14) is at around 66 on the daily time frame indicating strength by sustaining above 50 and the Ichimoku Cloud is also suggesting a bullish move.
Observation of the above factors indicates that a bullish move in Sobha is possible for target upto Rs 867. One can initiate a buy trade in the range of Rs 760-762, with a stop-loss of Rs 690 on daily closing basis.
GSFC: Buy | LTP: Rs 187 | Stop-Loss: Rs 170 | Target: Rs 220 | Return: 18 percent
Gujarat State Fertilizers & Chemicals has seen breaking out of a resistance zone after almost five years on the weekly timeframe with a bullish candlestick and above average volume which indicates strength. The stock is also trading above all its important EMAs on the daily timeframe which acts as a confluence.
The Supertrend indicator is also indicating a bullish continuation which supports the bullish view. Momentum oscillator RSI (14) is at around 67 on the daily timeframe indicating strength by sustaining above 50. Ichimoku Cloud is also suggesting a bullish move as the price is trading above the conversion line, base line and cloud.
Observation of the above factors indicates that a bullish move in GSFC is possible for target upto Rs 220. One can initiate a buy trade in between the range of Rs 185-186.5, with a stop-loss of Rs 170 on daily closing basis.
Expert: Jigar S Patel, senior manager - equity research at Anand Rathi
Avenue Supermarts: Buy | LTP: Rs 3,936 | Stop-Loss: Rs 3,785 | Target: Rs 4,200 | Return: 7 percent
On a weekly scale, D-Mart has formed a solid base near Rs 3,600, exactly near its historical support of Rs 3,500. Moreover, the recent up-move is supported by decent volume along with a violation of the downward-sloping trendline, which is looking lucrative.
On the indicator front, RSI (relative strength index) weekly has taken support on 50 levels and reversed from there, thus hinting towards a bullish bias in the counter.
Thus, we advise traders to go long in the stock in the range of Rs 3,900–3,950 with a stop-loss of Rs 3,785 for the upside target of Rs 4,200.

Reliance Industries: Buy | LTP: Rs 2,349 | Stop-Loss: Rs 2,285 | Target: Rs 2,450 | Return: 4.3 percent
On July 20, 2023, it made a high of Rs 2,631. Since then, it has been making lower top and lower lows, which resulted in a 336-point cut (336 rupees) in price (12.77 percent). At the current juncture, near the support of Rs 2,300-2,320, selling pressure is gradually slowing down.
Having said that, on daily scale, bullish BAT structure is spotted. Along with RSI daily making an impulsive structure after completing bullish divergence near the oversold zone of 30 levels, which is making Reliance a lucrative buy candidate.
Thus, we advised going long in the said counter in the range of Rs 2,335–2,350 with a target of Rs 2,450 and a stop-loss of Rs 2,285 on a daily close basis.
Disclaimer: The views and investment tips expressed by investment experts on Moneycontrol.com are their own and not those of the website or its management. Moneycontrol.com advises users to check with certified experts before taking any investment decisions.
Disclaimer: MoneyControl is a part of the Network18 group. Network18 is controlled by Independent Media Trust, of which Reliance Industries is the sole beneficiary.
Discover the latest Business News, Sensex, and Nifty updates. Obtain Personal Finance insights, tax queries, and expert opinions on Moneycontrol or download the Moneycontrol App to stay updated!
Find the best of Al News in one place, specially curated for you every weekend.
Stay on top of the latest tech trends and biggest startup news.


