


The market corrected sharply, but traded in the range of 300-350 points (21,500-21,850). Given the long bearish candlestick formation and breaking of the 10-day EMA (exponential moving average - 21,569), if the index breaks 21,500, then the correction may be seen up to 21,350-21,300, but if it manages to hold the same, then the above range may continue in the coming sessions, experts said.
On January 8, the Nifty 50 tanked 198 points or 0.91 percent to 21,513, while the BSE Sensex dropped 671 points or 0.93 percent to 71,355. The broader markets also saw correction, with the Nifty Midcap 100 and Smallcap 100 indices falling 1 percent and six-tenth of a percent.
Stocks that outperformed broader indices and staged strong performance included Keystone Realtors, Capri Global Capital, and Suzlon Energy. Keystone Realtors rallied 7 percent to end at record closing high of Rs 711 and formed strong bullish candlestick pattern on the daily charts with robust volumes. Further, the stock traded above all key moving averages (20, 50, 100, and 200-day EMA - exponential moving averages).
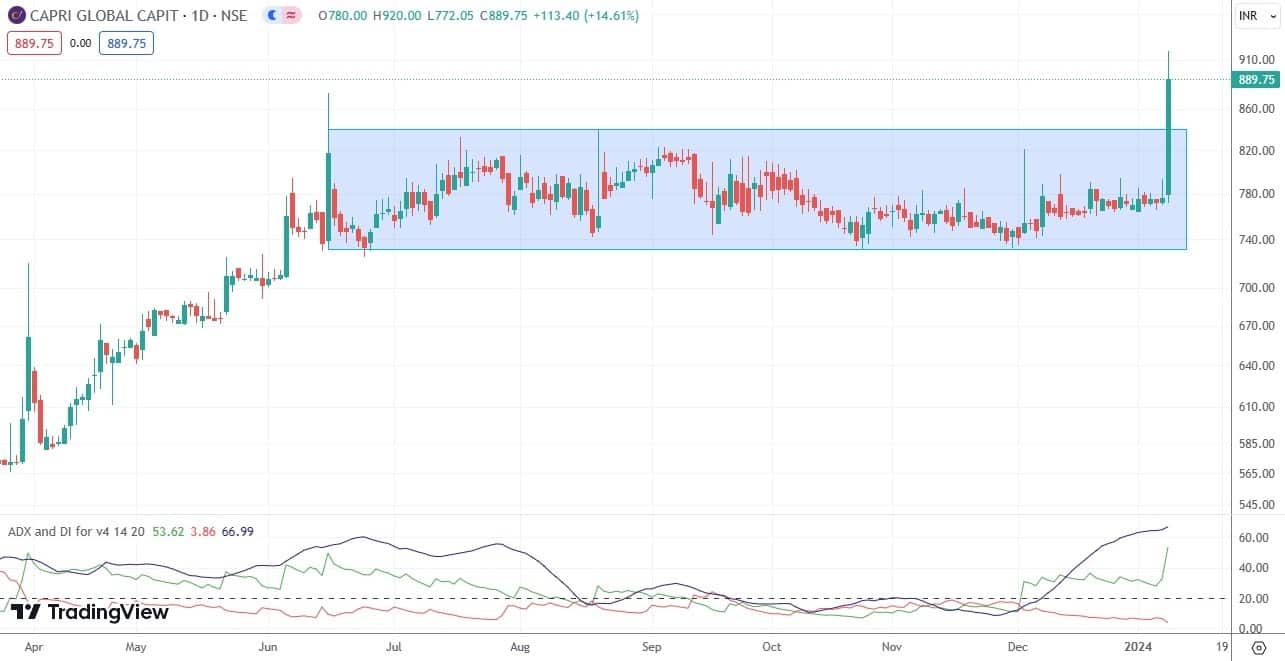
Capri Global Capital has seen a breakout of falling resistance trendline adjoining highs of June 15 and December 4 last year, and formed robust bullish candlestick pattern on the daily timeframe with significantly higher volumes. The stock jumped 14.6 percent to end at record closing high of Rs 890.
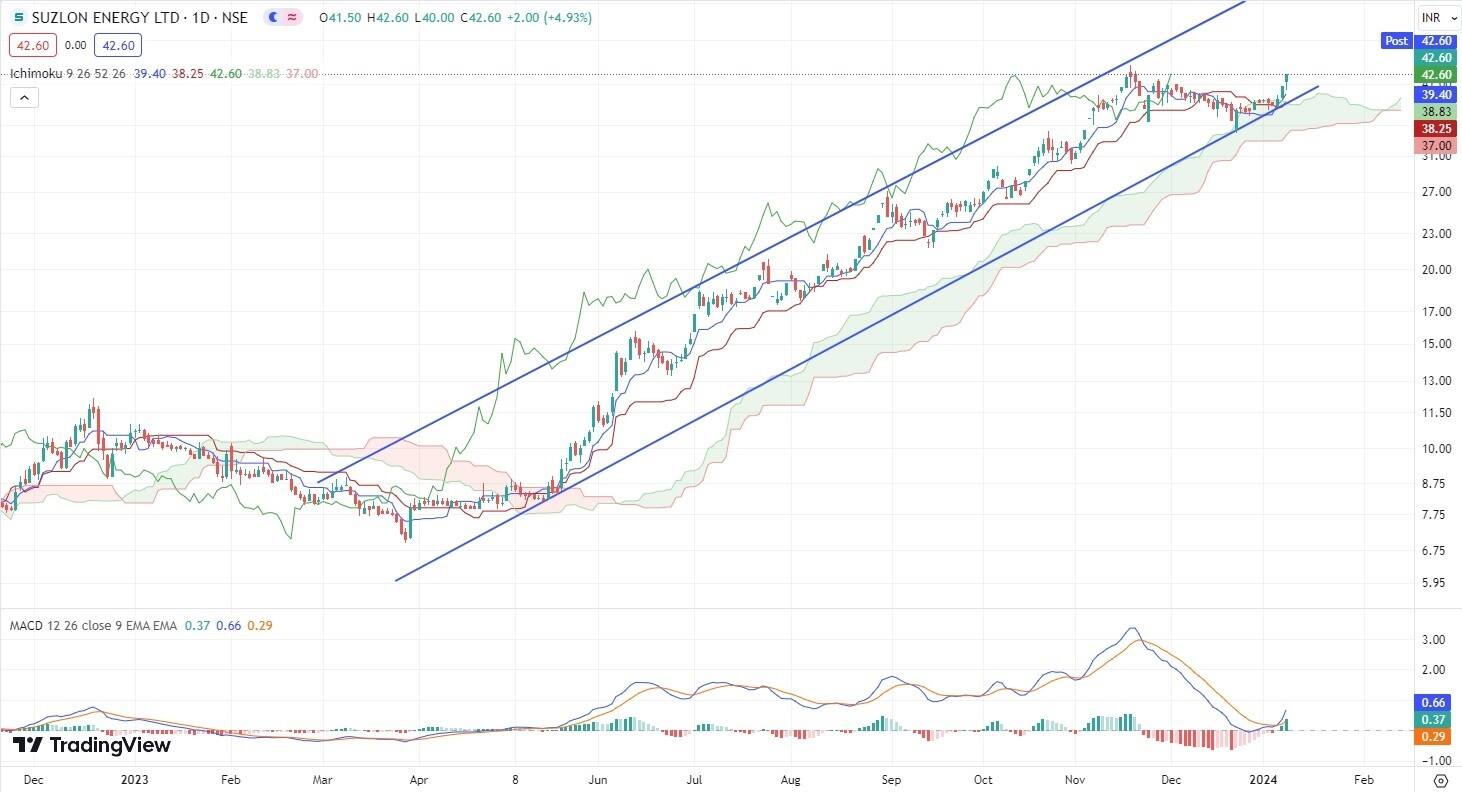
After recent consolidation, Suzlon Energy picked up the momentum and climbed 5 percent to Rs 42.60, the highest closing level since July 2011, with above average volumes. The stock has formed bullish candlestick pattern with long lower shadow on the daily charts, indicating buying interest at lower levels.
Here's what Ashish Kyal of Waves Strategy Advisors recommends investors should do with these stocks when the market resumes trading today:
Suzlon Energy has maintained its upward momentum even as major indices have declined. As we can see from the below chart, prices are currently getting close to the previous swing high, which is around Rs 44 levels. Prices precisely moved up, taking the support of the channel, where Ichimoku cloud support was also there.
Along with this, MACD has shown bullish crossover which is acting as a double confirmation. Momentum is picking and stock has potential to move upside from current levels. However, for the better risk reward it would be advisable to use buy on dips approach.
In short, outlook for Suzlon energy looks bullish. Use dips as a buying opportunity with the targets of Rs 44. While on the downside, Rs 38.90 can act as a near term support which is also a channel support.
Price action on a daily time frame indicates that bullish momentum is probably going to continue. Additionally, the formation of higher highs and higher lows is still in place as the price continues to rise and make new highs. Since December 29, 2023 prices are continuously giving a close above the upper bands.
Along with this, volumes are increasing. Increasing volumes supports the uptrend. Along with this, ADX (average directional index) is trading near 36 levels which suggests good momentum can be seen in this stock.
In short, overall bias remains bullish for Keystone realtors. One can use any dip for buying opportunity for further upside move towards Rs 735 as long as Rs 660 remains intact of the downside on closing basis.

CGCL has been moving higher recently and intact in strong uptrend. On the daily chart, in the previous session prices formed a bullish candle. Price was moving in a rectangular range over the last few days indicating accumulation in the stock. Price has closed above this trading range which result into a bullish breakout of the rectangular pattern.
We have shown ADX indicator which gives an indication if the stock is trending or in a trading range. The ADX of this stock is 66.99 giving an indication of a trending market. As the reading above 25 means strong directional strength.
In short, trend for this stock is positive. Use dips towards Rs 870-880 as a buying opportunity for a move towards Rs 970-980 levels as long as Rs 840 holds on the downside.
Follow Ashish Kyal on Twitter - @kyalashish
Disclaimer: The views and investment tips expressed by investment experts on Moneycontrol.com are their own and not those of the website or its management. Moneycontrol.com advises users to check with certified experts before taking any investment decisions.
Discover the latest Business News, Sensex, and Nifty updates. Obtain Personal Finance insights, tax queries, and expert opinions on Moneycontrol or download the Moneycontrol App to stay updated!
Find the best of Al News in one place, specially curated for you every weekend.
Stay on top of the latest tech trends and biggest startup news.


