markets
What is Relative Strength India?
Jul 12, 04:07
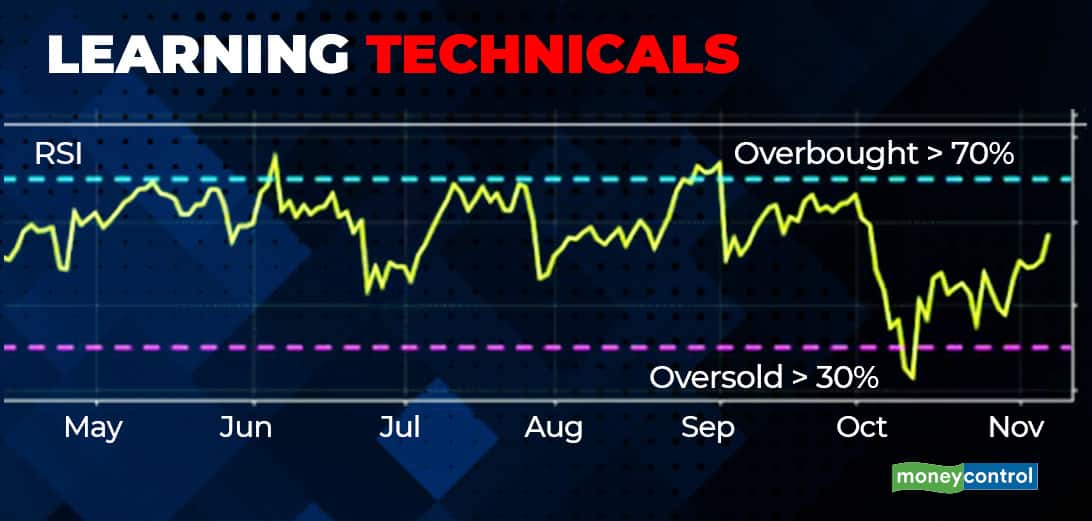
Relative Strength India, or RSI as it is popularly known, is a momentum indicator used in technical analysis by traders to evaluate overbought or oversold conditions in the price of the underlying security, which could be a stock or an index itself. The RSI is displayed as a line graph that moved within a range of 0 to 100. An RSI reading above 70 indicates that the security is becoming or approaching the overbought stage. This usually results in some selling pressure. What about the inverse? An RSI reading of 30 or below suggests that the security is oversold and could see a bounceback. RSI is usually plotted just below the asset price graph.