


India's stock market closed in green in an unpredictable week (ending on December 13) that saw intense action between the bulls and bears, but the Nifty50 index ended the week on a positive note with a modest gain of 0.37%, closing at 24,768 points. While the market experienced a divergence between the performance of midcap and smallcap stocks, the overall outlook remains promising, driven by select sectors demonstrating strong growth potential.
Despite the volatility, specific sectors have managed to shine brightly. There was a breakout of the Definedge EQW Textile Index, which tracks 52 textile-related stocks.
The Power of Equal-Weighted Indexes
The Equal Weighted Index (EQW) provides a better understanding of sector performance. Unlike traditional market-capitalisation weighted indices, where larger companies can disproportionately influence overall performance, the EQW treats all constituent stocks equally. This approach provides a clearer picture of how a sector as a whole is performing rather than being swayed by a few dominant players.
The Definedge EQW Textile Index, which tracks 52 companies in the textile industry, is particularly insightful. This sectoral index offers a more comprehensive view of the textiles market, one that acknowledges the industry's cyclical nature—demand often fluctuates due to both domestic and international factors.
Definedge EQW Textile Index Heikin Ashi Weekly Chart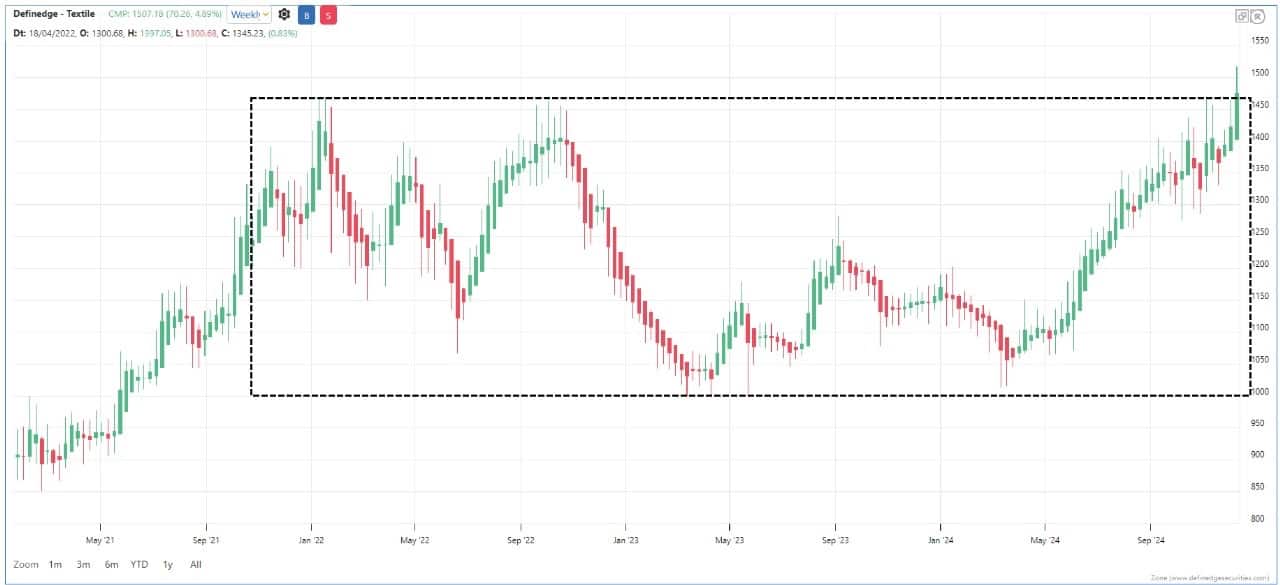 The Heikin Ashi chart, which is often used to identify trends and momentum, shows that the bulls are gaining strength. A larger body candle indicates the bullish trend is getting stronger, a sign that the sector is entering a bullish phase. This breakout marks the end of a two-year consolidation period and could signal a new era of growth for textile stocks.
Multi-Timeframe Relative Strength in Textile Stocks
To further refine our understanding of sector performance, we employ a range of technical tools, including the Multi-Timeframe Relative Strength (RS) Matrix. This scanner tracks relative strength patterns across multiple timeframes—daily, weekly, monthly, and quarterly—allowing for a more dynamic and flexible stock performance analysis.
The RS Matrix assigns a score to each stock based on its performance across these various timeframes. A score of 1 indicates that the stock is performing bullishly, while a score of 0 reflects a bearish trend. Stocks that score four across all timeframes are considered to be outperforming and qualify as potential candidates for further investment.
This method offers an efficient way to identify stocks showing consistent bullish behaviour across different timeframes. In the case of the textile sector, the following stocks have been identified as top performers, demonstrating strong relative strength across multiple timeframes:

The above stocks are outperforming the Definedge EQW Textile Index in multiple timeframes and are potentially positioned to outperform the broader textile sector. For readers looking for high-potential candidates within the textile space, these names could serve as a starting point for further research and analysis.
The Road Ahead: Optimism and Growth Potential
Looking ahead, the outlook for the Indian stock market remains optimistic as Nifty50 is on the verge of breaking the previous high of 24,857, especially with the strengthening performance of key sectors.
The bullish movement in the textile sector, combined with the broader economic recovery trend, sets the stage for continued optimism.
With a focus on emerging sectors, strong technical analysis, and an eye on key performance indicators, readers can continue to find opportunities in textile stocks that potentially promise rewarding returns.
Note: The purpose of this article is only to share interesting charts, data points and thought-provoking opinions. It is not a recommendation. This article is strictly for educative purposes only.
Disclaimer: The views and investment tips expressed by investment experts on Moneycontrol.com are their own and not those of the website or its management. Moneycontrol.com advises users to check with certified experts before taking any investment decisions.
Discover the latest Business News, Sensex, and Nifty updates. Obtain Personal Finance insights, tax queries, and expert opinions on Moneycontrol or download the Moneycontrol App to stay updated!
Find the best of Al News in one place, specially curated for you every weekend.
Stay on top of the latest tech trends and biggest startup news.


