The bulls rampage continued on the D-Street since the bulls extended their frenzy buying in the domestic markets. The benchmark index, Nifty, ended with gains for the seventh successive week. Over the week, the index earned around 2.5 percent. In terms of monthly gains, it is placed above the 6 percent mark (i.e. 6.57 percent to be more precise).
In our previous week's edition, we discussed the upside possibility of 21,400 in Nifty. This level was attained in the previous week. As we advance, the immediate resistance can be 21,500 for the index. This is because if we calculate the fall from 20,200 to 18,850, it comes to around 1,350 points in Nifty. Considering the breakout above 20,200, the index has rallied towards 21,500, which is again 1,300 points.
Thus, we might see some consolidation from 21,500 levels for the coming sessions. A move above the same might extend the rally towards 21,800. On the data front, Nifty PCR is above 1.45, which might result in some consolidation.

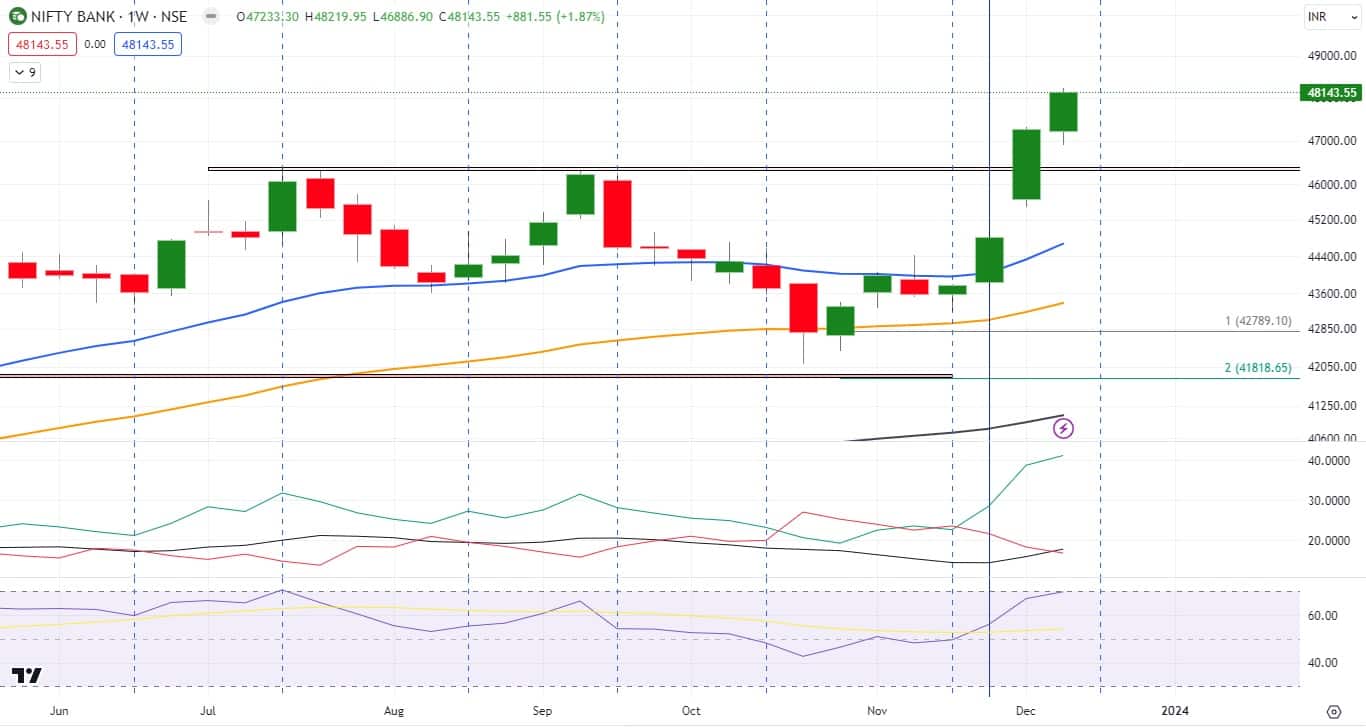
There was slight underperformance from the Nifty Bank index since the IT pack played a major role in pulling the Nifty. As of now, the Nifty Bank index is over 48,000, and it has the potential to reach the 50,000 milestone in the coming weeks. The view would be negated below 47,000 on a closing basis.
After registering the low of 26,184 on April 17, 2023, which was the potential reversal zone of the bullish BAT pattern, since then Nifty IT has been making higher highs and higher lows and pumped 9.763 points, which comes around massive 37 percent gains within just 7-8 months.
At the current juncture, the said index looks very bullish since it has taken out a 0.618 percent retracement of its previous fall in 2022. Going forward, we can expect solid support near 34,300 and resistance near 36,600. Heavyweights like TCS, Infosys, and HCL Technologies should be bought on every dip.

Since the last 3–4 months, Indian Railway Catering & Tourism Corporation (IRCTC) has been consolidating in the range of Rs 630–750. Recently, it gave a clean breakout from the said range, which is looking lucrative. Having said that, the breakout on a weekly scale looks genuine since it is accompanied by decent volume.
Additionally, it has taken out the 1-year-old bear trendline (refer to the chart). On the indicator front, the weekly RSI (relative strength index) has taken out its previous swing high of 60 and is currently placed near 68 levels, along with the weekly DMI’s (directional movement index) looking positive, which confirms our bullish stance in the counter.
One can buy in the zone of Rs 775-785 for an upside target of Rs 900 and stop-loss would be on a daily closing basis near Rs 719.

On the weekly time frame, the Inverse Head and Shoulder pattern was seen after decent consolidation between Rs 1,700 and Rs 1,790. Having said that, the mentioned Inverse Head and Shoulder are formed exactly near the potential reversal zone of the bullish BAT pattern, and the 200 EMA (exponential moving average) is providing support below it, which is making Kotak Bank a lucrative buy candidate.
On the indicator front, both daily RSI and DMI’s are displaying positive bias in the counter. Thus, one can buy in small tranches in the zone of Rs 1,835–1,855 and another in the zone of Rs 1,805–1,815 with an upside target of Rs 2,000, and the stop-loss would be placed near Rs 1,750 on a daily close basis.


Discover the latest Business News, Sensex, and Nifty updates. Obtain Personal Finance insights, tax queries, and expert opinions on Moneycontrol or download the Moneycontrol App to stay updated!
Find the best of Al News in one place, specially curated for you every weekend.
Stay on top of the latest tech trends and biggest startup news.