


Indian markets moved in a narrow range for the first four days of the week, but a sharp rise in the first hour on Friday saw the market touching new highs and closing the week around 0.65 percent higher. Strong foreign institutional investor (FII) buying in the cash and derivative markets, along with a robust trend in global markets, positive initial corporate numbers, and increased sowing due to the strong progress of the monsoon, helped the Indian markets hold their ground and move higher.
While the Indian market was largely subdued, global markets continued to be strong. The Dow Jones touched the 40,000 mark for the second time ever, and the S&P 500 crossed 5,600 for the first time, marking its 37th record close in 2024. The Nasdaq saw its 27th record close this year, indicating strong momentum in the US market.
The Nikkei 225 finally touched a new high, a milestone the Japanese market hadn't reached since 1989, taking 35 years to surpass. The MSCI World Index grew by 1.39 percent, while the European Stoxx 600 rose by 1.45 percent. Chinese and Hong Kong markets also joined the rally, with gains of 0.72 percent and 2.77 percent, respectively.
Divergence Suggests a Loss of Momentum
The Nifty index inched up this week, continuing its bullish momentum. In the near term, the 24,000-24,150 range can serve as a good support zone. The bullish trend in the Nifty index is likely to continue as long as it stays above this support zone.
The 20-day Advance/Decline (A/D) line (see chart) has cooled off significantly from the second red line. Despite this, the Nifty index is forming higher highs and higher lows, leading to some divergence. This indicates that the Nifty index continues to inch higher while the broader market has narrowed. Such scenarios are typical in bull markets. Initially, everything moves up, but as the uptrend unfolds, market breadth narrows, and multiple divergences form before the index finally peak.
The first phase, where everything moves up, is over. From here, the market may experience a slow grind, with fewer stocks participating in the uptrend. Given that the 20-day A/D line has cooled off significantly from its recent highs, there is scope for breadth expansion as the Nifty index continues its uptrend. This pattern is similar to what we observed in the past two instances highlighted in the chart.
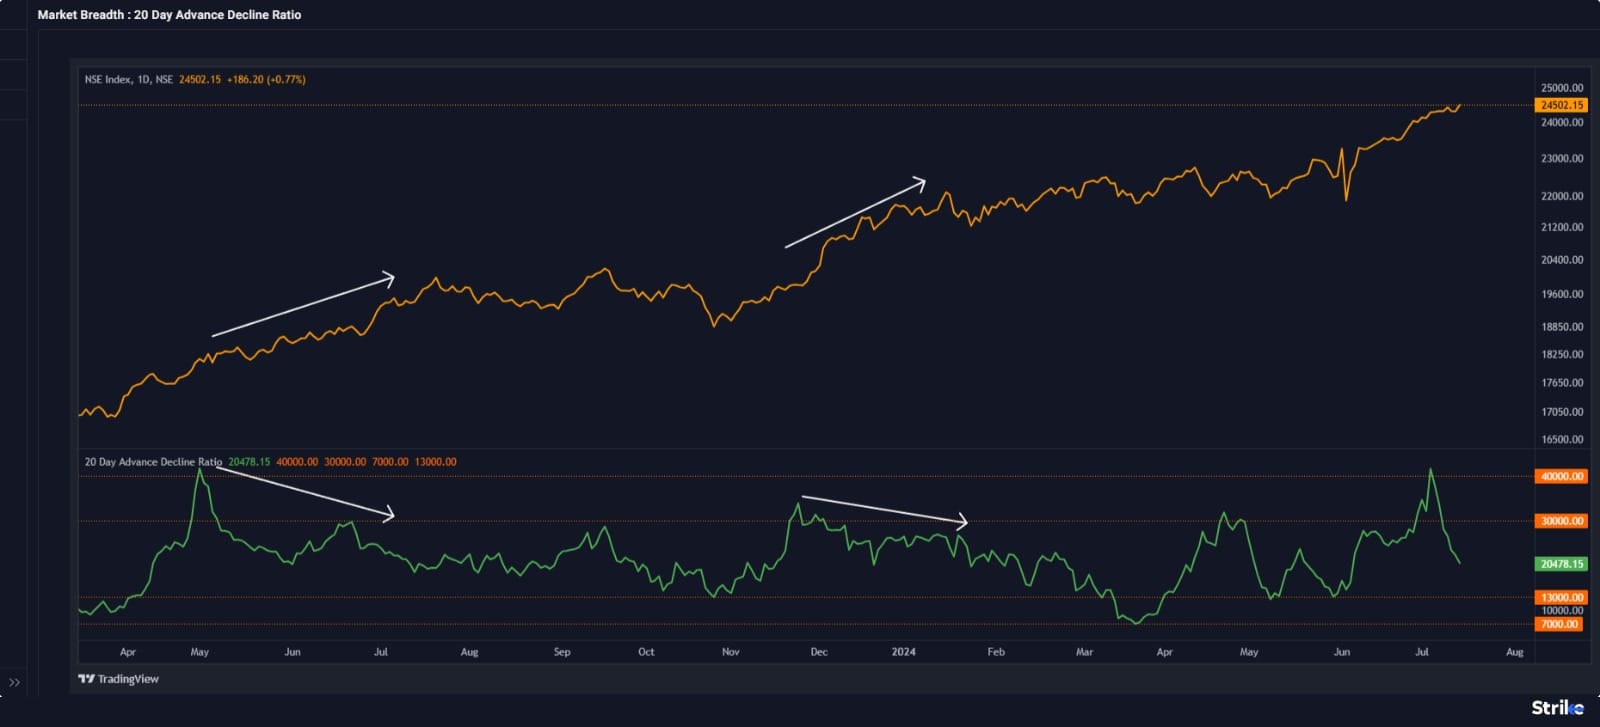
Advance Decline Ratio
Source: web.strike.money
The first indicator below the Nifty index chart is the Net New – One-Quarter High for the Nifty 50 index, which shows a rising trend. The indicator at the bottom is the Net New – One-Quarter High for the Nifty Small Cap 100, which shows a declining trend (see chart New Quarterly Highs). This indicates that large-cap stocks display more strength than small-cap stocks, with more large-cap stocks making net new highs than their small-cap counterparts.
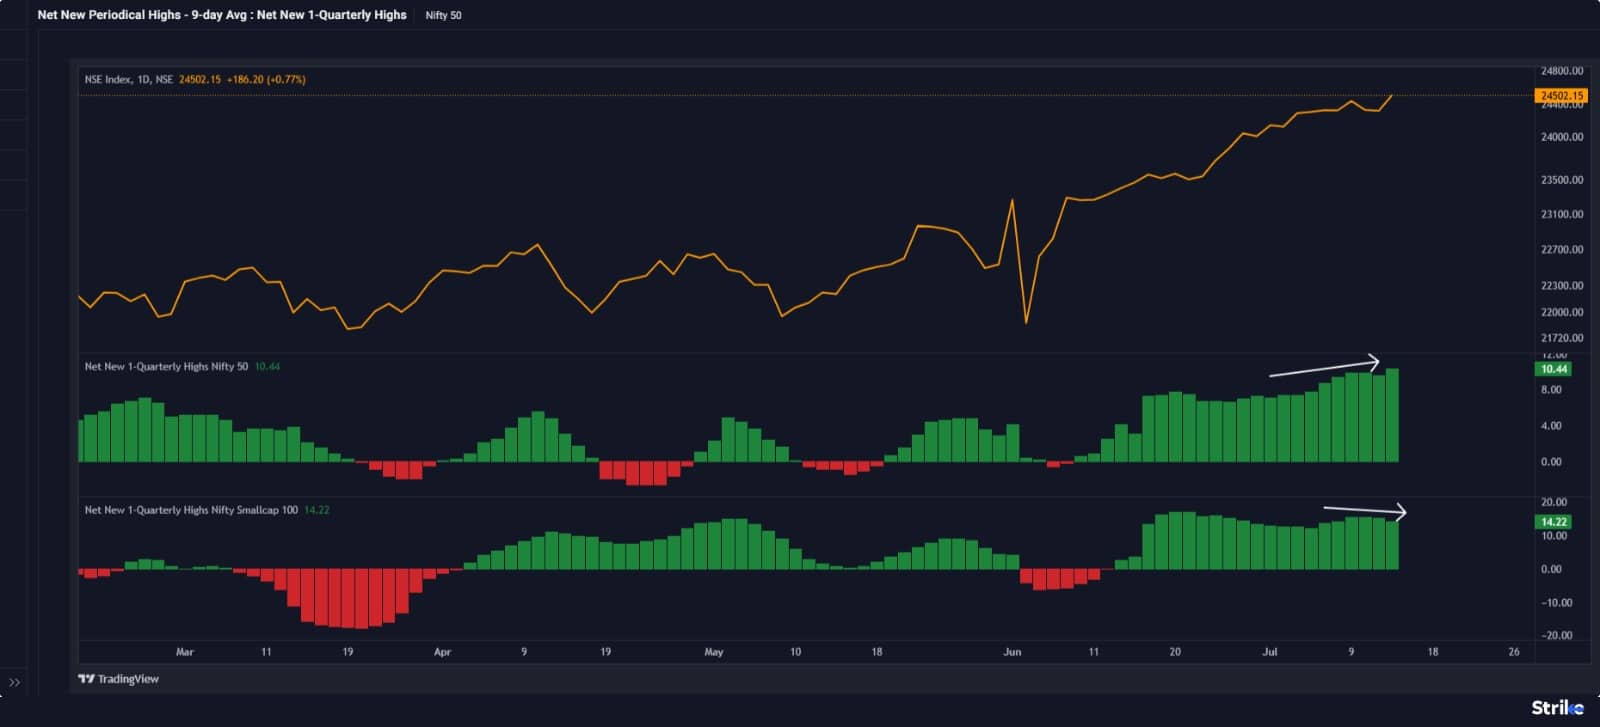
New Quarterly Highs
Source: web.strike.money
The FIIs' long positions in index futures are sustaining at higher levels, resembling the 2017-2018 phase when FIIs maintained high levels of long positions in index futures for an extended period (see chart FII Net Index Futures Position). During that phase, the Nifty index experienced minor corrections but continued to rise overall. Eventually, significant divergence was observed until the Nifty index broke its trendline support.
A similar pattern might occur in the current phase. In the short term, the 24,000-24,150 range is a strong support zone, while 23,600-23,700 is a solid support zone positionally. Some divergence between the Nifty index and FII positioning in index futures may be seen, but this is not a cause for concern at the moment. The Nifty index trend remains upward as long as the aforementioned levels hold.
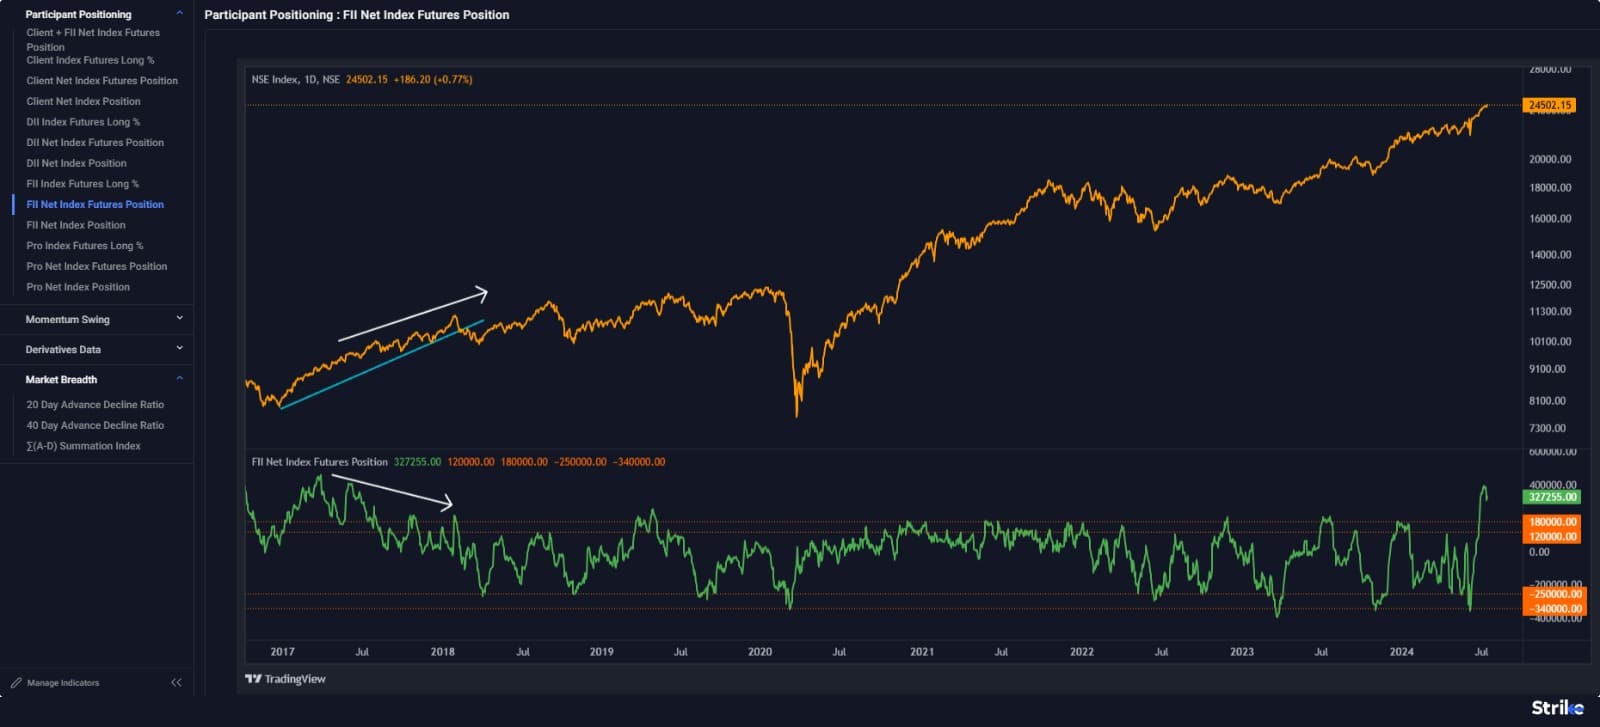
FII Net Index Futures position
Source: web.strike.money
Sector Rotation
The Nifty IT index remained in the leading quadrant last week, showing no signs of weakness. Other sectors, including Nifty PSE, Nifty CPSE, Nifty Oil & Gas, Nifty Healthcare, and Nifty Energy, also entered the leading quadrant in the Relative Rotation Graph (RRG). However, Nifty Oil & Gas and Nifty Energy have seen some loss of momentum.
Sectors like Nifty FMCG, Nifty Pharma, Nifty Commodities, Nifty Infra, and Nifty MNC are in the improving quadrant. The Nifty Pharma index is close to entering the leading quadrant, and once it does, it could outperform the benchmark Nifty 50 index. Conversely, Nifty Commodities and Nifty Infra curling back down from the improving quadrant is not a good sign. If they enter the lagging quadrant, it would indicate underperformance relative to the Nifty index.
The Nifty Financial Services and Nifty Private Bank indices are marginally outperforming the Nifty 50 but show a significant loss of momentum.
Nifty Consumer Durables, Nifty Bank, Nifty Media, Nifty Realty, Nifty Auto, Nifty PSU Bank, and Nifty Metal are in the lagging quadrant. However, the momentum in Nifty Media is picking up, which is a positive sign. Nifty Metal was close to entering the improving quadrant but has now moved towards the west, indicating a decline.
Nifty PSU Banks, Nifty Auto, and Nifty Realty are also moving westward, which is not a positive sign as it indicates deteriorating relative strength compared to the benchmark Nifty 50, suggesting increasing underperformance.
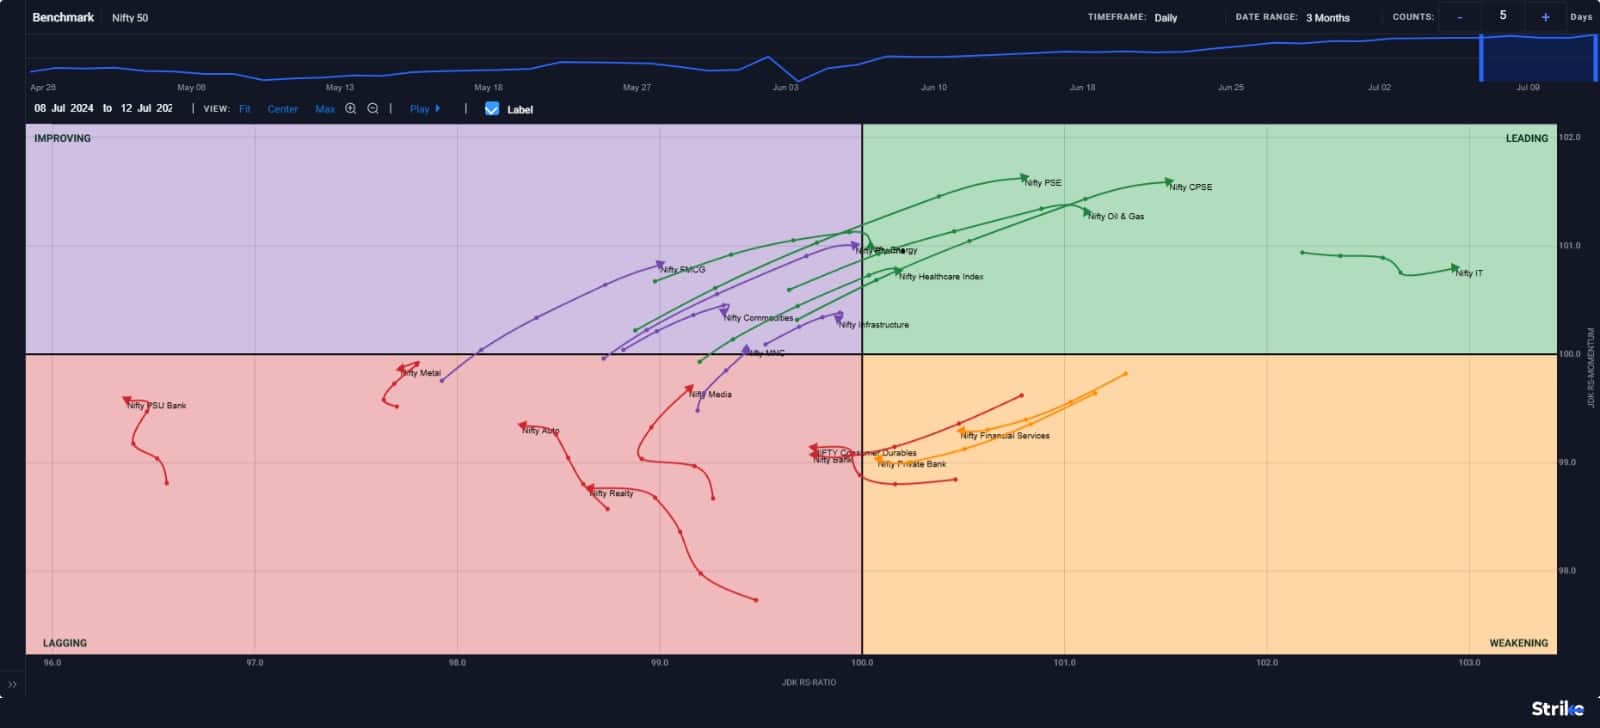
RRG
Source: web.strike.money
During the week, several sectors demonstrated significant movements. Metals posted a solid comeback, though they have not yet matched the performance of the headline index. The recent strength in metals indicates a potential upward trend. The IT and FMCG sectors continued to show strength, making the IT sector a clear market favourite.
Over the longer 90-day period, certain sectors, such as public sector companies and the Oil & Gas sector, have shown resilience to short-term fluctuations.
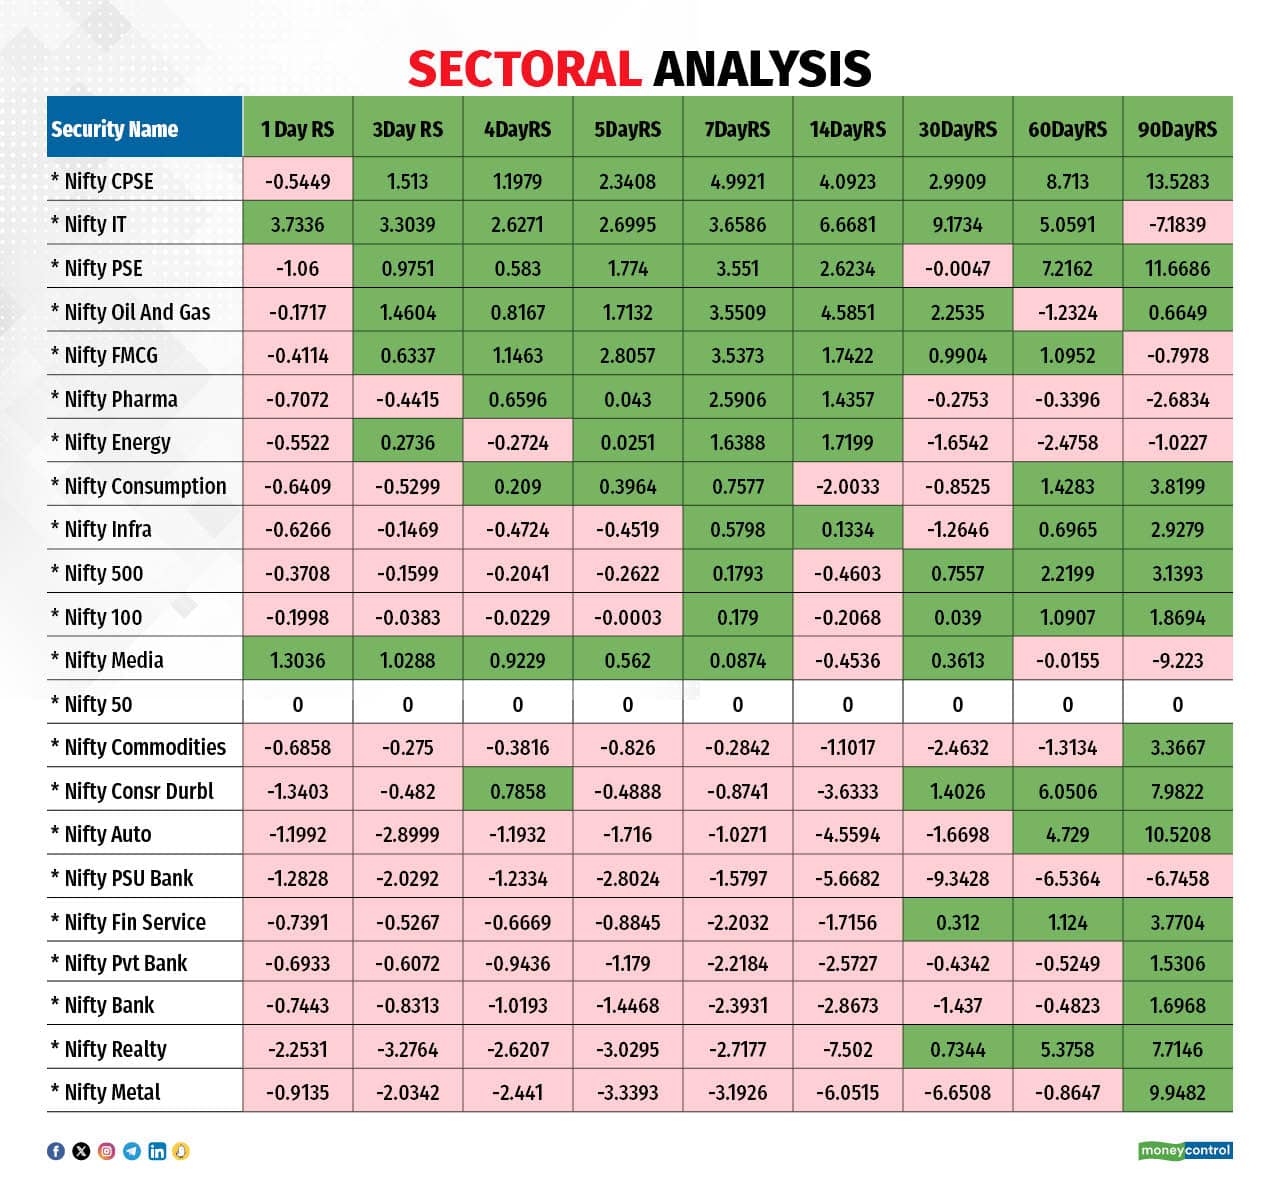
Sector Strength
Source: Quant Lab
Indices and Market Breadth
With the start of the earnings season, stock-specific movements were observed in the market, with the benchmark indices gaining 0.65 percent. The broader market moved in a narrow range, with the mid-cap index gaining 0.04 percent and the small-cap index closing 0.15 percent higher.
Foreign Institutional Investors (FIIs) continued to buy in the domestic market, adding Rs 3,843.99 crore during the week, bringing the monthly total to Rs 10,718.65 crore.
Among the top gainers in the derivative basket were REC, closing 9.80 percent higher, Manappuram Finance, up 6.82 percent, and ONGC, which gained 6.56 percent.
The top losers for the week were Bank of Baroda, which fell 8.47 percent, RBL Bank, which was down 6.36 percent, and M&M, which fell 6.13 percent.
Stocks to watch
Among the stocks expected to perform better during the week are Britannnia, Reliance, ICICI GI, Glenmark, Colgate Palmolive, Dabur, Petronet, Infy, Aurobindo Pharma and Godrej Consumer.
Cheers, Shishir Asthana

Discover the latest Business News, Sensex, and Nifty updates. Obtain Personal Finance insights, tax queries, and expert opinions on Moneycontrol or download the Moneycontrol App to stay updated!

Find the best of Al News in one place, specially curated for you every weekend.
Stay on top of the latest tech trends and biggest startup news.


