
Shabbir Kayyumi
What is Inverse Head & Shoulders Pattern?
The head and shoulders chart pattern is popular and easy to spot pattern. Patterns are formed due to supply and demand dynamics and decisions traders take in certain situations.
In technical analysis, an Inverse head and shoulders pattern describes a specific chart formation that projects a bullish trend reversal.
An Inverse Head and Shoulders reversal pattern forms after completion of a down trend. In the standard Inverse head and shoulders pattern, we connect the high after the left shoulder with the high created after the head.
A trend line is drawn by connecting these highest points of the two peaks, which is called as “Neckline". This trend line is the most important component of Inverse H&S pattern.
Why to buy Biocon?
Biocon Limited is trading in an up move while forming Inverse Head & Shoulders pattern and this emerging pattern will be completed on a close above 263 marks. This stock is trading near strong resistance line standing around 263 levels which is tested multiple times earlier which also suggest a strong bullish bias to continue further after a breakout.
Recent formation of Inverse Head & Shoulders classical pattern will give a breakout by trading only above Rs 263 marks, suggests buying in the stock for higher targets of Rs 308. Volume will also add further insight while trading these patterns. Decent volume participation while giving breakout will also give support to Inverse H& S pattern.
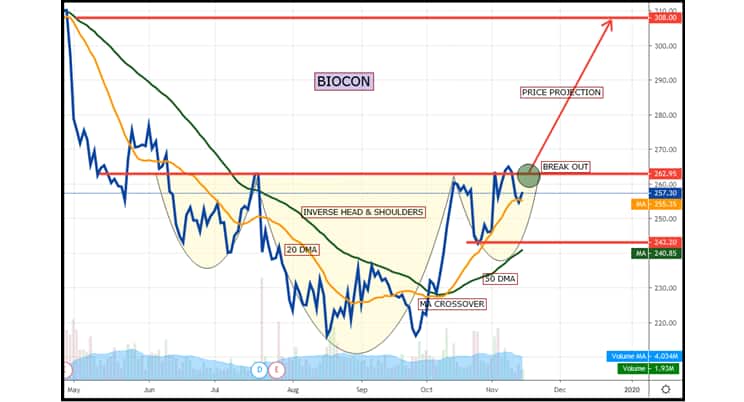 Figure.1. Inverse Head & Shoulders pattern and Buy signal on Biocon
Buy Signal:
> A decisive close above neckline (263) of Inverse Head & Shoulders pattern will give a pattern breakout.
> Prices must trade above short- term moving average 20 DMA which will define bullish short-term trend.
> Mid- term moving average 50 DMA defines mid-term trend is very well augur with bulls as prices are sustained and trading above it.
> Decent volume participation while pattern breakout will also give additional confirmation.
Profit Booking:
> Target as per Inverse Head & Shoulders pattern is calculated by adding height of head (H) to neckline which comes to 308, however one can book profits near previous swing high which is around 290 levels.
Stop Loss:
> Entire bullish view negates on breaching of right shoulder on closing basis and one should exit from long position. In case of Biocon it is placed around Rs 240 levels.
Conclusion
We recommend buying Biocon above Rs 263 levels with a stop loss of Rs 240 for higher targets of Rs 308 as indicated in above chart.
(The Author is Head - Technical & Derivative Research, Narnolia Financial Advisors)
Disclaimer: The views and investment tips expressed by investment experts on Moneycontrol.com are his own and not that of the website or its management. Moneycontrol.com advises users to check with certified experts before taking any investment decisions.

Discover the latest Business News, Sensex, and Nifty updates. Obtain Personal Finance insights, tax queries, and expert opinions on Moneycontrol or download the Moneycontrol App to stay updated!

Find the best of Al News in one place, specially curated for you every weekend.
Stay on top of the latest tech trends and biggest startup news.