
The Nifty broke the three-day winning streak on Monday as technology stocks fell sharply on the back of lower than expected results from TCS. Nifty recovered more than hundred points from the low and finally ended the day with the losses of 5 points at 16,216 levels.
From the recent swing low of 15,183, Nifty has risen more than 1,000 points. During this recovery Nifty managed to form two back to back higher tops and higher bottoms on the daily charts. Nifty has also managed to surpass the crucial resistances of its 20 and 50 days EMA (exponential moving average), currently placed at 15,940 and 16,155 levels respectively.
Nifty has filled the entire down gap between 15,886 and 16,172, which was formed on June 13, 2022. Closing of this gap indicates the negation of the possible resumption of a downtrend. Nifty has broken out from the downward sloping trendline, adjoining the major swing highs of April 4, 2022 (18,114) and June 3, 2022 (16,793). This price breakout has confirmed the bullish trend reversal.
Moreover, after forming positive divergence, both RSI (relative strength index) and MACD (moving average convergence divergence) have given trendline breakout on the daily chart of Nifty, which could result in to bullish momentum phase for the Index.
In the Index Futures segment, FIIs covered their shorts during the last week, where their net long to short ratio has moved up to 0.38 level from 0.18 levels, the highest since June 7, 2022. In the Option segment we have seen aggressive Put writing at 15,900-16,000 levels. This level also coincides with the 20 days EMA. Therefore, our advice is to remain bullish and accumulate longs with the trailing stop-loss of 15,900 levels.
Immediate resistance for Nifty is seen around 16,500 levels, at which 200-day EMA is placed. Far resistance is seen around 16,800 levels.
Nifty Midcap and Smallcap indices have outperformed the benchmark indices on Monday. We expect them to outperform during coming weeks and therefore focus of the traders should be on the midcaps/smallcaps to generate higher returns from here on.
Here are three buy calls for the next 3-4 weeks:
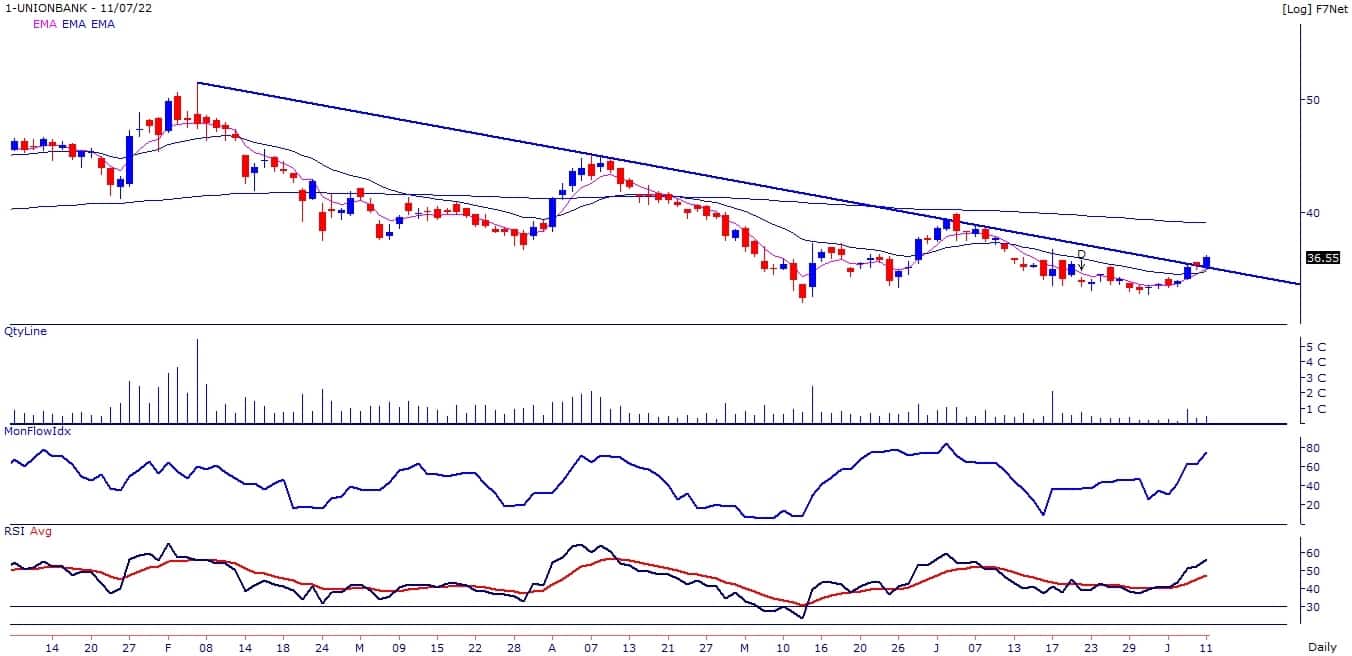
Union Bank of India: Buy | LTP: Rs 36.55 | Stop-Loss: Rs 34.5 | Target: Rs 40-42 | Return: 9-15 percent
The stock price has broken out from the downward sloping trendline on the daily chart, adjoining the highs of February 7 and April 7, 2022. Short term trend of the stock is positive as it is trading above its 5 and 20 days EMA.
Momentum Oscillators - RSI and MFI (money flow index) have placed above 60 and sloping upwards, indicating strength in the current uptrend of the stock. Plus DI is trading above Minus DI while ADX line has crossed 20 levels, indicating momentum in the current uptrend.
SP Apparels: Buy | LTP: Rs 380 | Stop-Loss: Rs 355 | Target: Rs 420-440 | Return: 11-16 percent
The stock price has broken out on the daily charts with higher volumes where it closed at highest level since June 28, 2022. The stock price has broken out from the downward sloping trendline on the daily chart, adjoining the highs of February 3 and June 8, 2022.
Short term trend of the stock is positive as it is trading above its 5 and 20 days EMA. Momentum Oscillator like RSI (11) is placed above 60 and sloping upwards, indicating strength in the current uptrend of the stock.

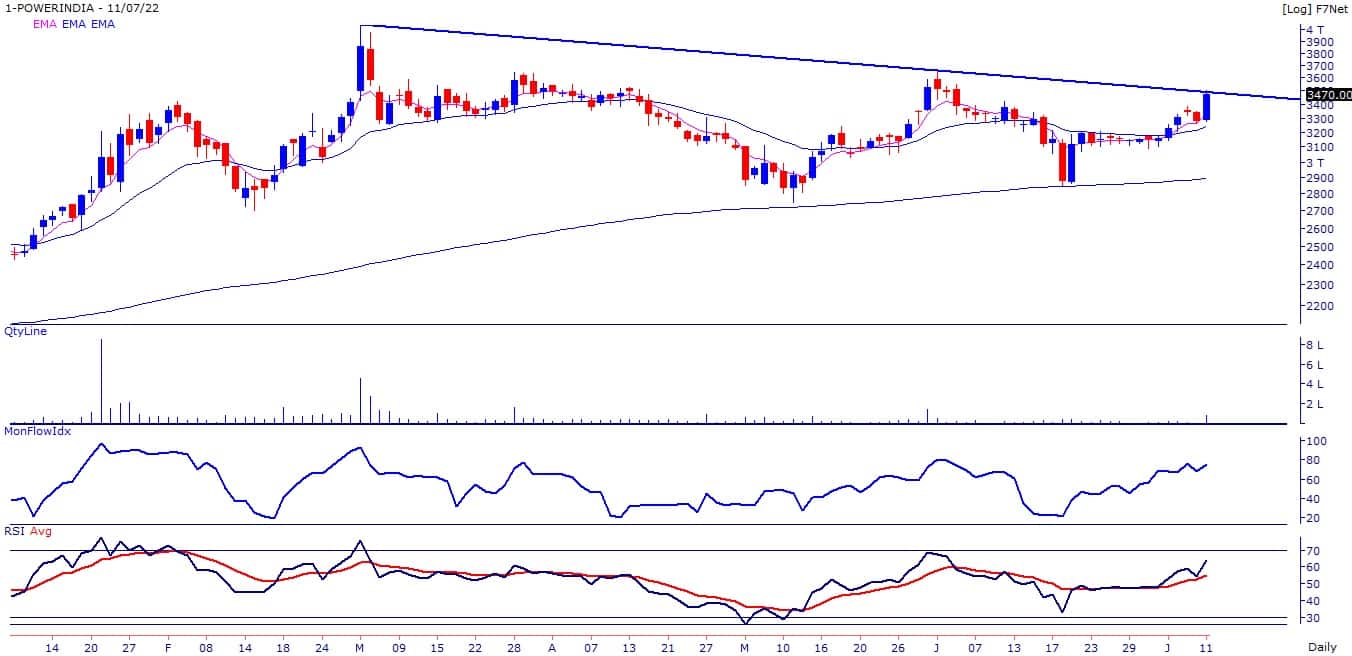
Hitachi Energy India: Buy | LTP: Rs 3,470 | Stop-Loss: Rs 3,300 | Target: Rs 3,750-3,900 | Return: 8-12 percent
The stock price has broken out on the daily chart with higher volumes where it closed at highest level since June 2, 2022. The stock price is on the verge of breaking out from the downward sloping trendline, adjoining the highs of March 3 and June 1, 2022.
Momentum Oscillator like RSI and MFI is placed above 60 and sloping upwards, indicating strength in the current uptrend of the stock. Plus DI is trading above Minus DI while ADX line is placed above 20, indicating momentum in the current uptrend.
Disclaimer: The views and investment tips expressed by investment experts on Moneycontrol.com are their own and not those of the website or its management. Moneycontrol.com advises users to check with certified experts before taking any investment decisions.

Discover the latest Business News, Sensex, and Nifty updates. Obtain Personal Finance insights, tax queries, and expert opinions on Moneycontrol or download the Moneycontrol App to stay updated!

Find the best of Al News in one place, specially curated for you every weekend.
Stay on top of the latest tech trends and biggest startup news.