The market retreated from its intraday peak but closed higher on November 21. The Nifty struggled to maintain the 19,800 level and closed at 19,783, up 89 points. Midcap once again hit an all-time high.
The Nifty is consolidating in the 19,800–19,850 range, signaling a potential 1,000-point upswing. Immediate support is identified at 19,600–19,550, with crucial support at the 20-day moving average at around 19,350.
A bullish outlook would be maintained, with confirmation anticipated above the 19,850 mark. Further resistance is projected at 20,000 and 20,200.
The Bank Nifty is appearing relatively weak, yet a robust demand zone is observed at 43,400–43,300, suggesting a potential rebound. Noteworthy resistance levels are 43,800, 44,000, 44,200, and 44,400, posing challenges to upward momentum.
Investors should monitor developments closely for a potential shift in trend in the Bank Nifty.
Here are three buy calls for the short term:
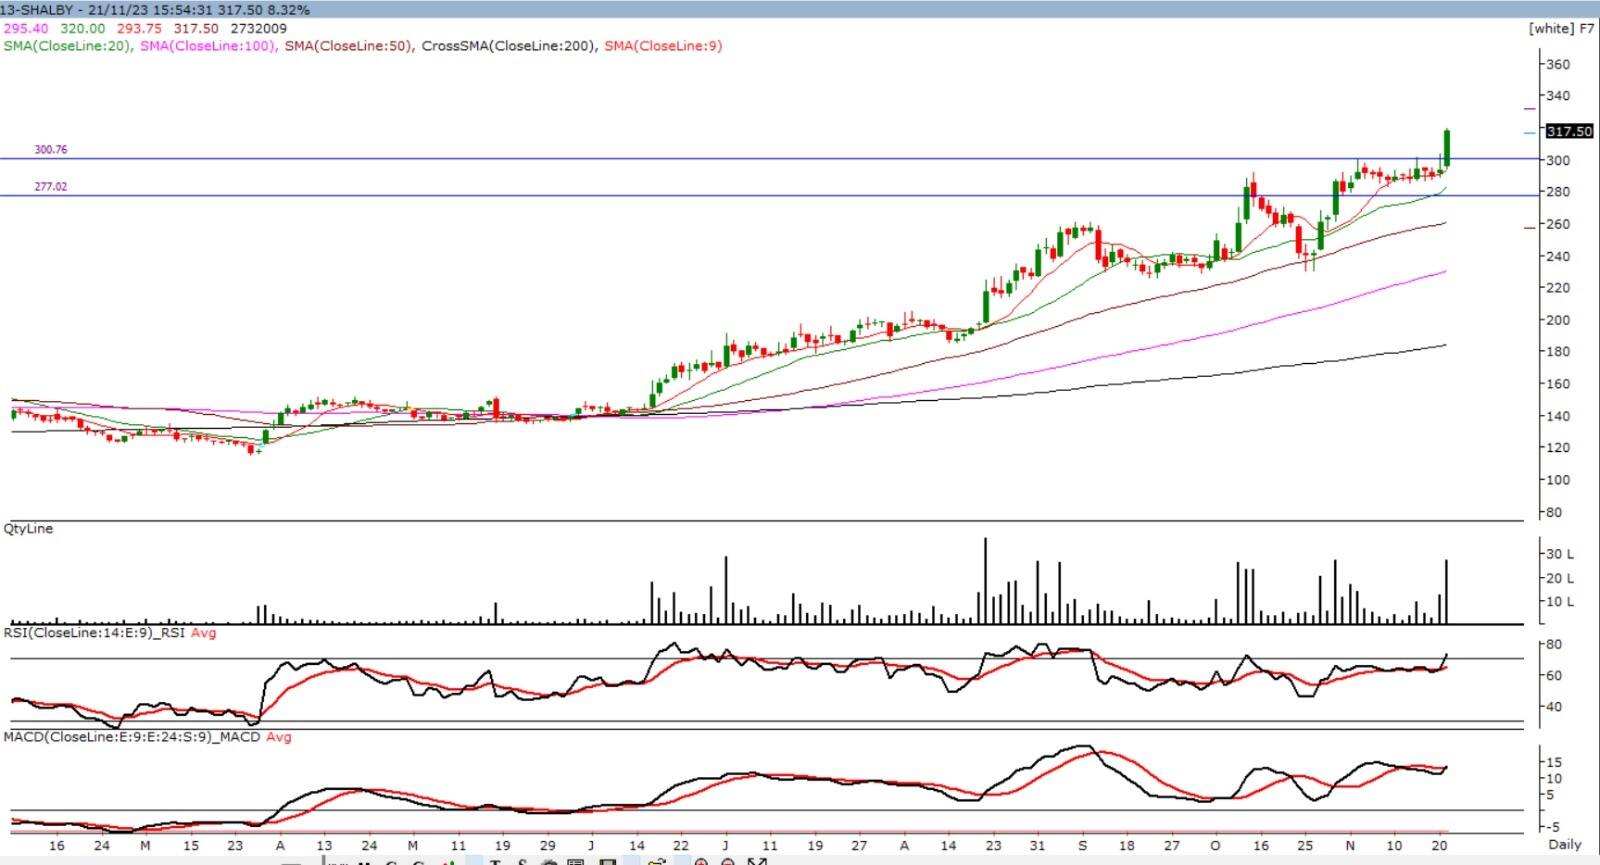
Shalby: Buy | LTP: Rs 317.50 | Stop-Loss: Rs 285 | Target: Rs 370 | Return: 16 percent
On the daily chart, the counter witnessed a breakout of a long consolidation formation with strong volume, while on the weekly chart, it has broken a Flag formation pattern. The counter has a classic structure because it is trading above all of its significant moving averages.
While the moving average convergence and divergence (MACD) indicator is experiencing an upward centerline crossover, the relative strength index (RSI), a momentum indicator, is positively poised.
On the upper side, Rs 340 is the immediate resistance, above which a big move till over Rs 370 can be expected in the shorter time frame. On the downside, Rs 285 is the demand zone for any correction.
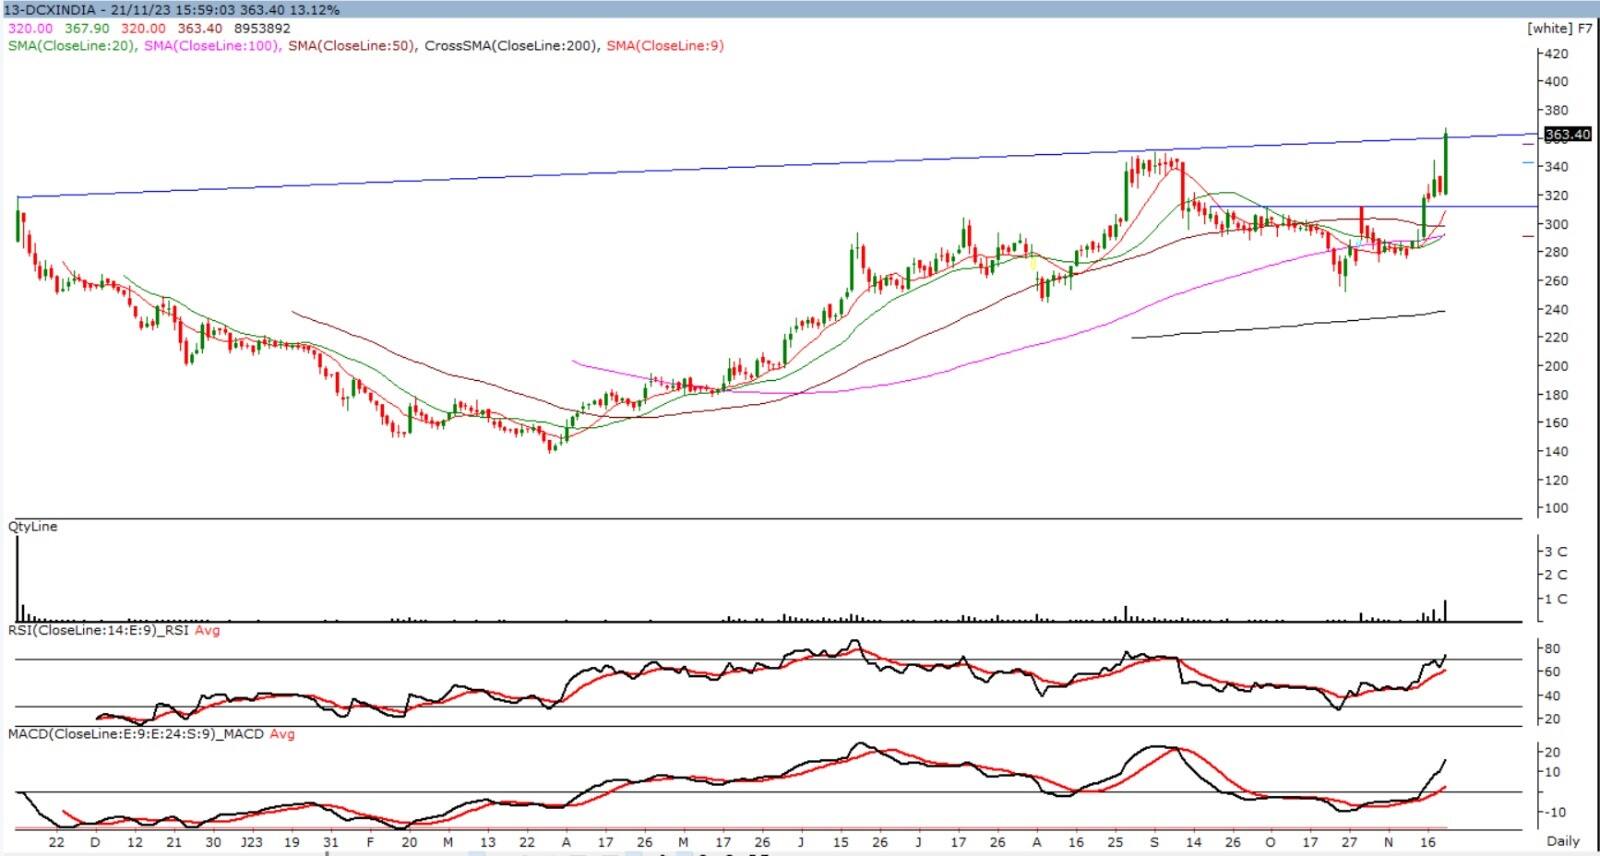
DCX Systems: Buy | LTP: Rs 363.4 | Stop-Loss: Rs 335 | Target: Rs 414 | Return: 14 percent
The counter witnessed a breakout of a bullish Inverse Head and Shoulder pattern with strong volume on the daily chart. It has also broken a Cup-and-Handle formation on the weekly chart. The overall formation of the counter is very classical, as it is trading above its all-important moving averages with a positive bias in momentum indicators.
On the upside, Rs 400 is an important psychological level, above which it can move towards Rs 414+. On the downside, a cluster of moving averages at around Rs 335 is a strong demand zone during any correction.
Both RSI and MACD indicators are supportive of the current strength of the stock's momentum.
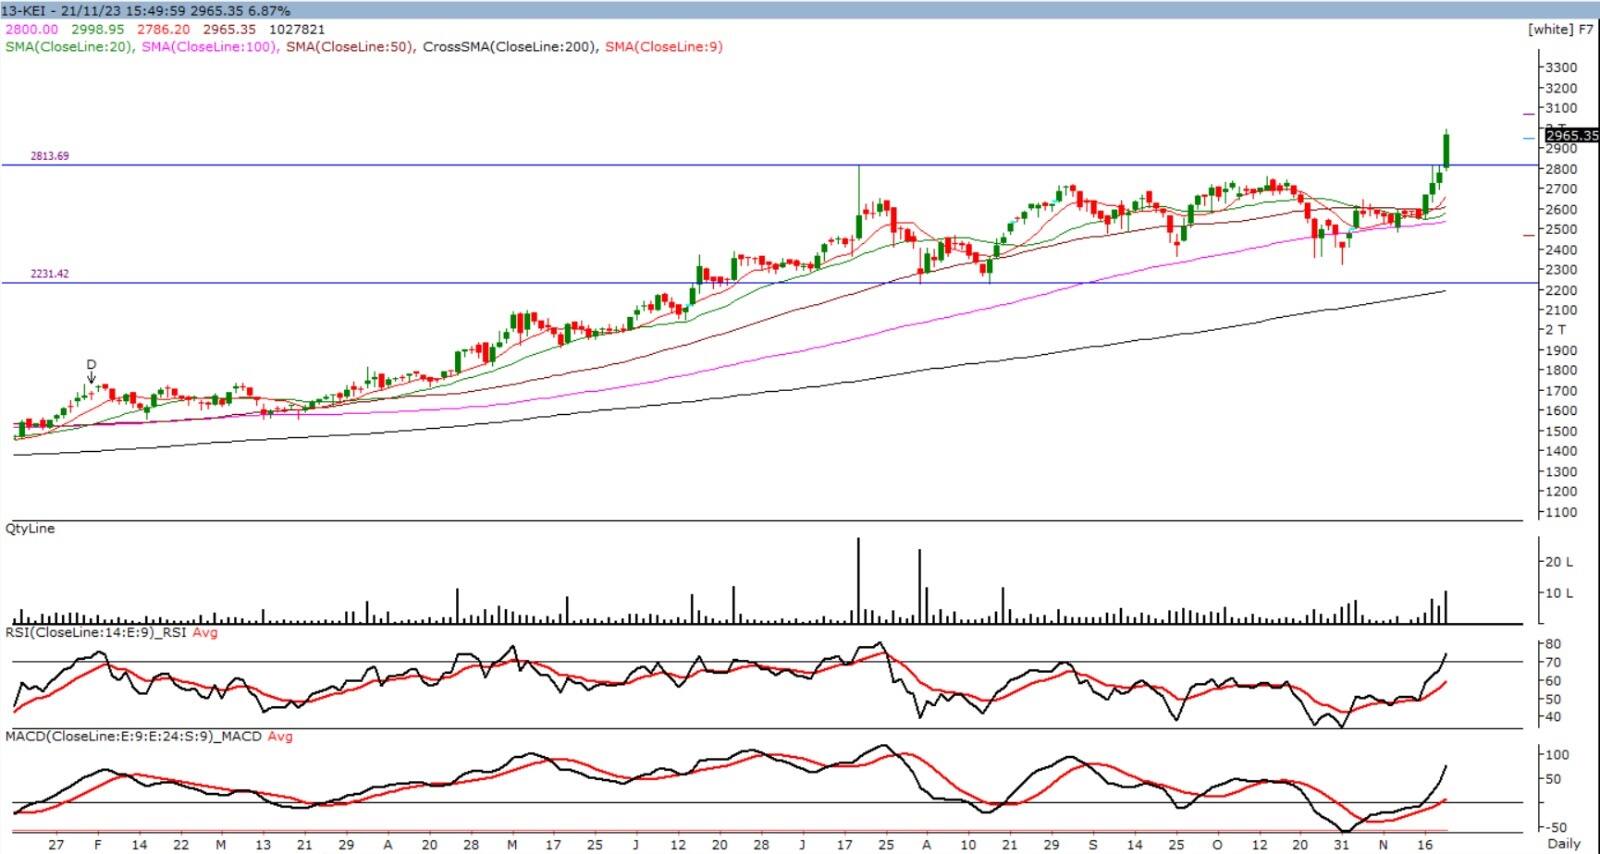
KEI Industries: Buy | LTP: Rs 2,965 | Stop-Loss: Rs 2,780 | Target: Rs 3,334 | Return: 12 percent
The counter is coming out of a long consolidation with strong volume. It looks lucrative on the daily chart. The pattern suggests an immediate target of Rs 3,200, while it has the potential to move further to Rs 3,340.
On the downside, Rs 2,780 will act as an immediate support level. MACD supports the current strength, whereas the momentum indicator RSI is also positively poised.
Disclaimer: The views and investment tips expressed by investment experts on Moneycontrol.com are their own and not those of the website or its management. Moneycontrol.com advises users to check with certified experts before taking any investment decisions.

Discover the latest Business News, Sensex, and Nifty updates. Obtain Personal Finance insights, tax queries, and expert opinions on Moneycontrol or download the Moneycontrol App to stay updated!

Find the best of Al News in one place, specially curated for you every weekend.
Stay on top of the latest tech trends and biggest startup news.