Advanced Technical Charts with Moneycontrol
Unlocking Trading Success with Technical Charts
Learn how to make smarter trading decisions with technical charts. Plot multiple Technical Indicators related to market trends, volatility, momentum and more and make informed decisions for better trading outcomes.
Click Here
Get a holistic view in one place!

Full Screen Charts
Get a full screen view of the charts with the pop-out feature.
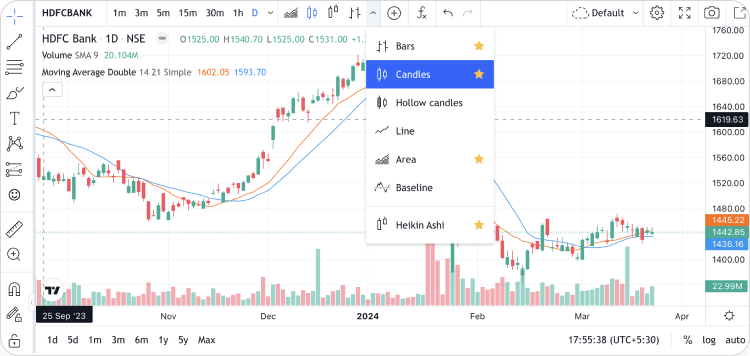
Array of Chart Types
Choose between different chart types, like bars, candles, line, hollow candles, Heikin Ashi and more.

Switch between the various Time Frames
Analyze a stock across various Time Frames, varying from 1 Min to Monthly as well as other time intervals.

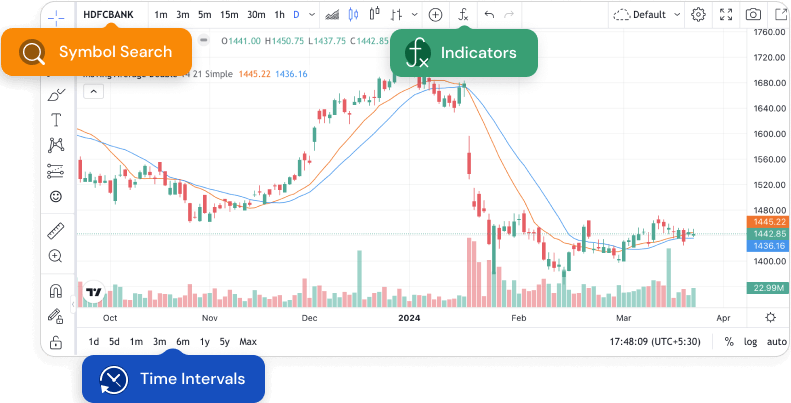
Advanced Charting Tools and Indicators
Deep Dive into the technicals of any stock/index/asset class with a variety of charting tools and indicators.
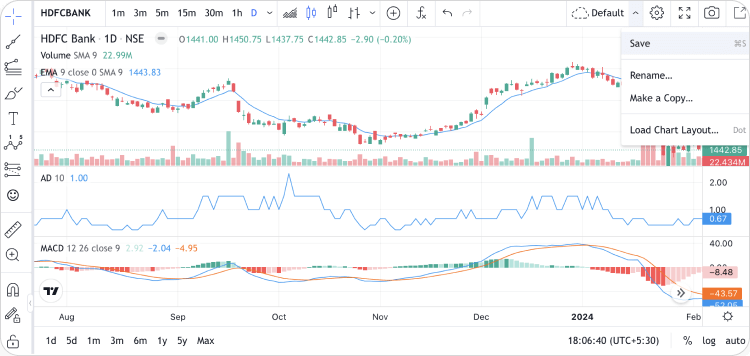
Customise and Save Charts
Build and Save multiple customised chart templates and layouts with indicators of your preferences. Charts of any stock/index/asset class can subsequently be studied using your saved templates/ layouts.
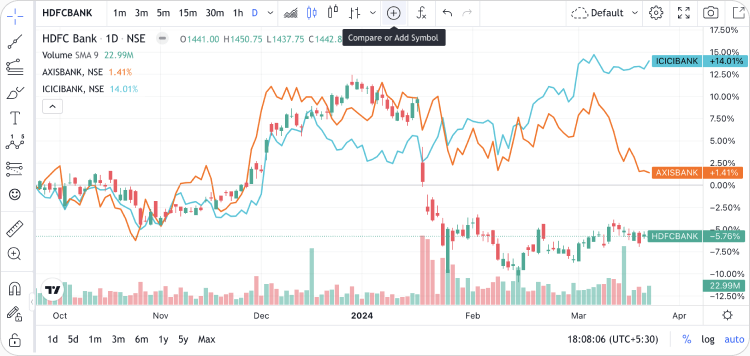
Compare Charts
View charts of multiple stocks/indices - all at once - for easier relative strength analysis across stocks, markets and asset classes.
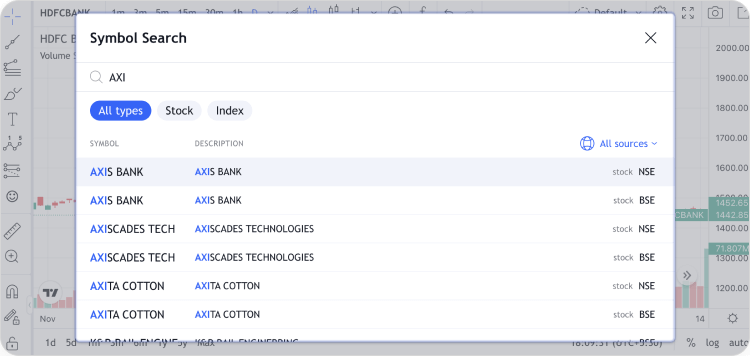
Search Stocks and Indices
Search the stock/index of your choice, while in full-screen chart mode, and it will instantly open a selection search window.